|
100
|
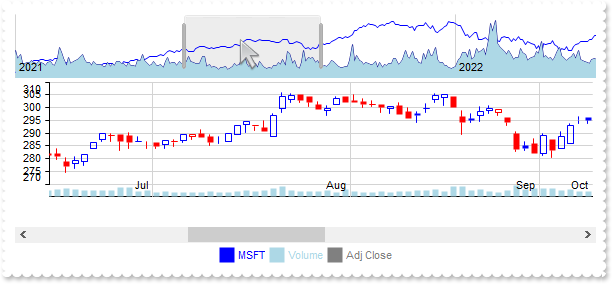
Show a combination of lines and filled curves in the overview
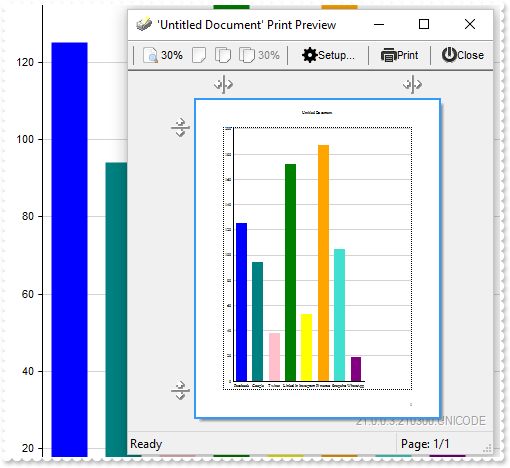
exgraph1.BeginUpdate();
exgraph1.ValueSize = 6;
exgraph1.VisualAppearance.Add(1,"C:\\Program Files\\Exontrol\\ExGraph\\Sample\\EBN\\googlebtn.ebn");
exgraph1.set_Background32(exontrol.EXGRAPHLib.BackgroundPartEnum.exOverviewSelResize,0x1808080);
exgraph1.set_Background32(exontrol.EXGRAPHLib.BackgroundPartEnum.exOverviewSel,0x1f0f0f0);
exgraph1.Data = "C:\\Program Files\\Exontrol\\ExGraph\\Sample\\Data/msft.csv";
exgraph1.SeriesColors = "blue,lightblue,green";
exontrol.EXGRAPHLib.ValueAxes var_ValueAxes = exgraph1.ValueAxes;
exontrol.EXGRAPHLib.ValueAxis var_ValueAxis = var_ValueAxes.Add(null);
var_ValueAxis.Start = 0.1;
var_ValueAxis.CursorFormat = "(value format ``) replace `.` with `<font ;6><off -4><fgcolor A0A0A0> `";
exontrol.EXGRAPHLib.ValueAxis var_ValueAxis1 = var_ValueAxes.Add("2nd");
var_ValueAxis1.End = 0.1;
var_ValueAxis1.Visible = false;
var_ValueAxis1.MajorGridLines.Color = -1;
exontrol.EXGRAPHLib.CategoryAxis var_CategoryAxis = exgraph1.CategoryAxis;
var_CategoryAxis.Categories = "Date";
var_CategoryAxis.Format = "value mid 9 left 2";
exontrol.EXGRAPHLib.FormatGridLinesOptions var_FormatGridLinesOptions = var_CategoryAxis.ChartGridLines;
var_FormatGridLinesOptions.Format = "`<fgcolor black>` + ((0:=date(value)) format `mmm`) + (month(=:0) = 1 ? `<br><b>` + (=:0 format `YYYY`) : ``)";
var_FormatGridLinesOptions.Align = exontrol.EXGRAPHLib.DrawTextFormatEnum.exTextAlignBottom | exontrol.EXGRAPHLib.DrawTextFormatEnum.exTextAlignRight;
var_FormatGridLinesOptions.Color = "lightgray";
var_CategoryAxis.MajorTicks.Color = "black";
var_CategoryAxis.CursorFormat = "value left 10";
exontrol.EXGRAPHLib.FormatGridLinesOptions var_FormatGridLinesOptions1 = var_CategoryAxis.OverviewGridLines;
var_FormatGridLinesOptions1.Format = "value left 4";
var_FormatGridLinesOptions1.Color = "lightgray";
exontrol.EXGRAPHLib.Series var_Series = exgraph1.Series;
exontrol.EXGRAPHLib.Serie var_Serie = var_Series.Add(null,null);
var_Serie.Name = "<fgcolor blue>MSFT</fgcolor>";
var_Serie.Data = "Open,High,Low,Close";
var_Serie.Type = "candle";
var_Serie.CursorFormat = "`Open: <b>` + (%v0 format `0`) + `</b><br>High: ` + (%v1 format `0`) + `<br>Low: ` + (%v2 format `0`) + `<br>Close: <b>` + (%v1" +
" format `0`) + `</b>`";
exontrol.EXGRAPHLib.Serie var_Serie1 = var_Series.Add(null,null);
var_Serie1.Name = "<fgcolor lightblue>Volume</fgcolor>";
var_Serie1.Data = "Volume";
var_Serie1.Axis = "2nd";
var_Serie1.CursorFormat = "(name replace `lightblue` with `white`) + `: ` + (value format `0`)";
exontrol.EXGRAPHLib.Serie var_Serie2 = var_Series.Add(null,null);
var_Serie2.Name = "<fgcolor green>Adj Close</fgcolor>";
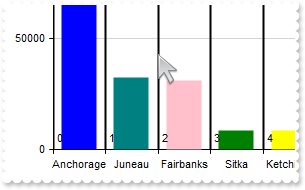
var_Serie2.Data = "Adj Close";
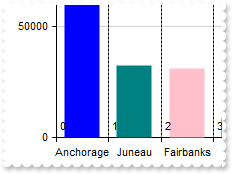
var_Serie2.Type = "line";
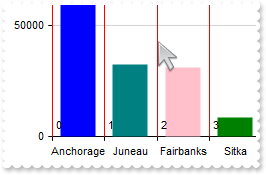
var_Serie2.set_Misc(exontrol.EXGRAPHLib.SerieMiscEnum.exLineSize,2);
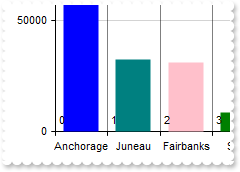
var_Serie2.Style = exontrol.EXGRAPHLib.SerieStyleEnum.exSpline;
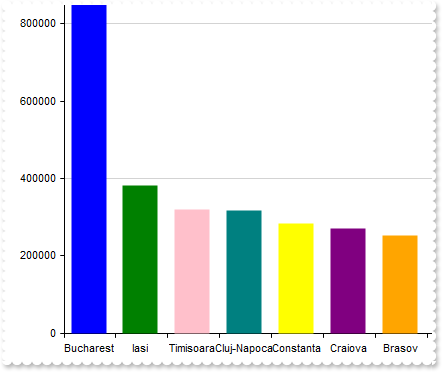
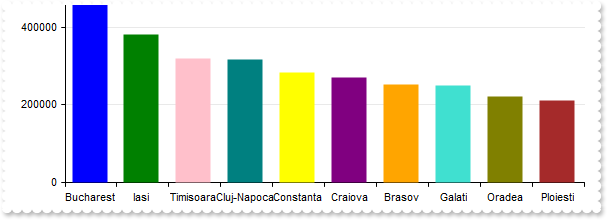
var_Serie2.Visible = false;
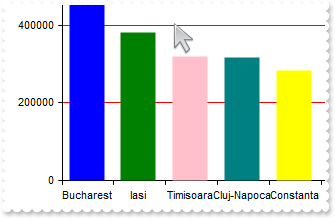
var_Serie2.CursorFormat = "(name replace `green` with `white`) + `: ` + (value format `0`)";
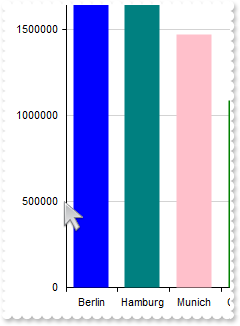
exontrol.EXGRAPHLib.Overview var_Overview = exgraph1.Overview;
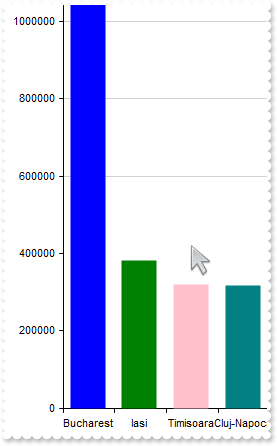
var_Overview.Visible = true;
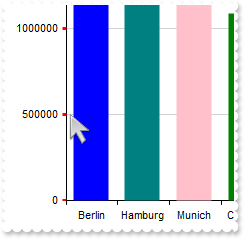
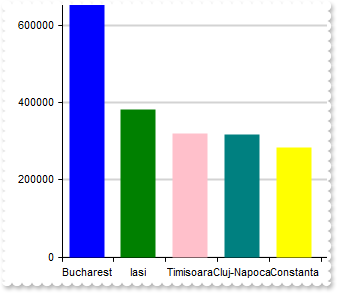
var_Overview.Serie = "0,1:darkblue-fill lightblue";
exontrol.EXGRAPHLib.Legend var_Legend = exgraph1.Legend;
var_Legend.Visible = true;
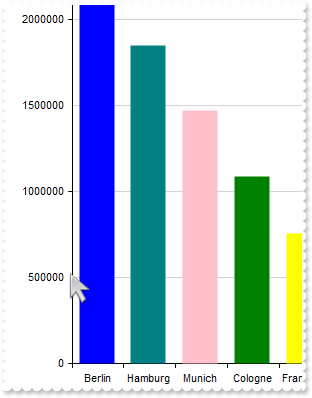
var_Legend.Grid = "x1";
exgraph1.Cursor.Visible = true;
exgraph1.EndUpdate();
|
|
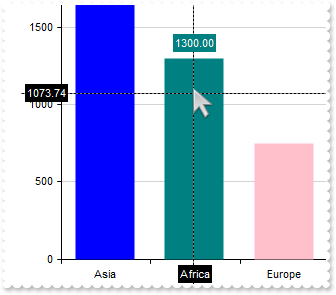
99
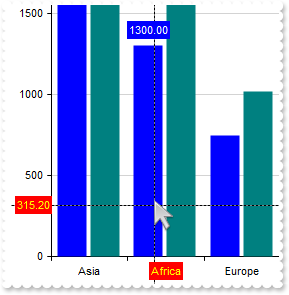
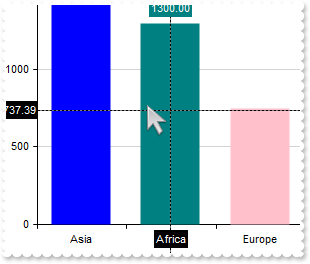
|
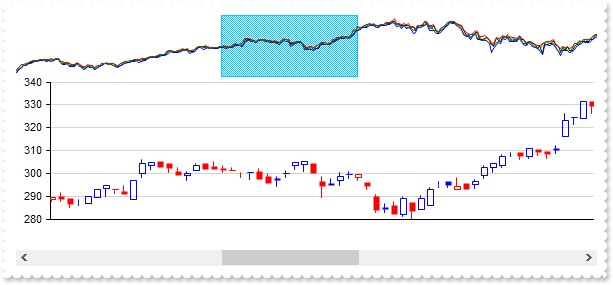
Display multiple curves of values in the overview
exgraph1.BeginUpdate();
exgraph1.ValueSize = 6;
exgraph1.Data = "C:\\Program Files\\Exontrol\\ExGraph\\Sample\\Data/msft.csv";
exontrol.EXGRAPHLib.Serie var_Serie = exgraph1.Series.Add(null,null);
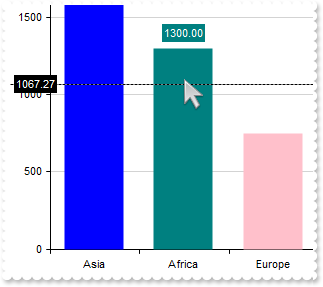
var_Serie.Name = "msft";
var_Serie.Data = "Open,High,Low,Close";
var_Serie.Type = "candle";
exontrol.EXGRAPHLib.Overview var_Overview = exgraph1.Overview;
var_Overview.Visible = true;
var_Overview.Serie = "0:black,0[1]:red,0[2]:blue,0[3]:green";
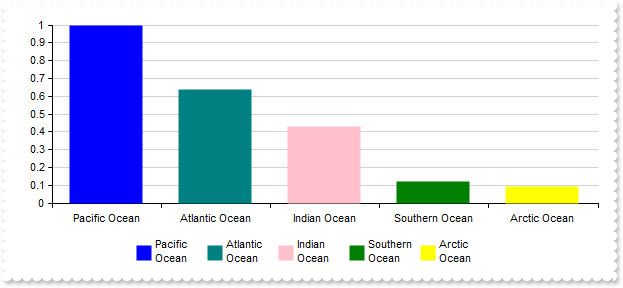
exgraph1.EndUpdate();
|
|
98
|
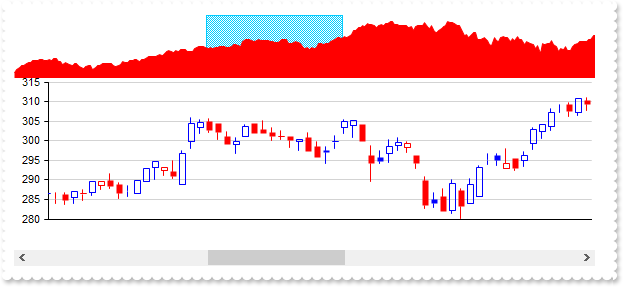
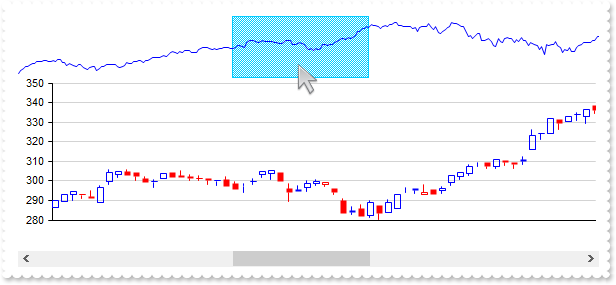
Display the series as a filled curve rather than a line in the overview
exgraph1.BeginUpdate();
exgraph1.ValueSize = 6;
exgraph1.Data = "C:\\Program Files\\Exontrol\\ExGraph\\Sample\\Data/msft.csv";
exontrol.EXGRAPHLib.Serie var_Serie = exgraph1.Series.Add(null,null);
	var_Serie.Name = "msft";
	var_Serie.Data = "Open,High,Low,Close";
	var_Serie.Type = "candle";
exontrol.EXGRAPHLib.Overview var_Overview = exgraph1.Overview;
	var_Overview.Visible = true;
	var_Overview.Serie = "0:red-fill";
exgraph1.EndUpdate();
|
|
97
|
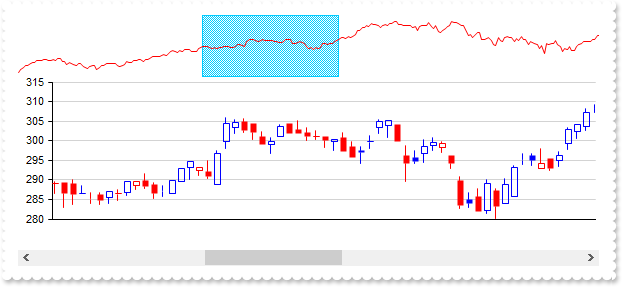
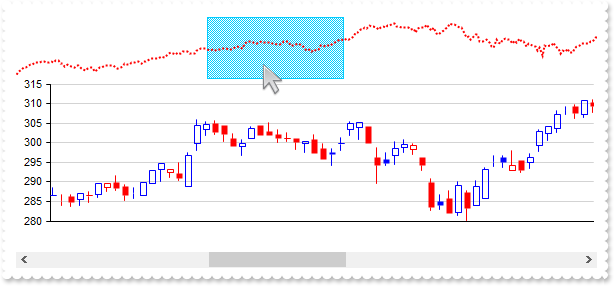
Redefine the color to show the serie within the overview
exgraph1.BeginUpdate();
exgraph1.ValueSize = 6;
exgraph1.Data = "C:\\Program Files\\Exontrol\\ExGraph\\Sample\\Data/msft.csv";
exontrol.EXGRAPHLib.Serie var_Serie = exgraph1.Series.Add(null,null);
	var_Serie.Name = "msft";
	var_Serie.Data = "Open,High,Low,Close";
	var_Serie.Type = "candle";
exontrol.EXGRAPHLib.Overview var_Overview = exgraph1.Overview;
	var_Overview.Visible = true;
	var_Overview.Serie = "0:red";
exgraph1.EndUpdate();
|
|
96
|
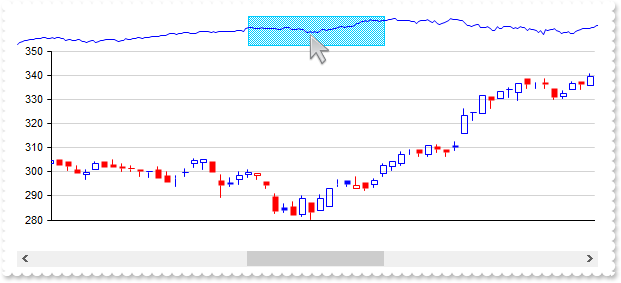
Defines the color, style and width/size to display the lines of values in the overview
exgraph1.BeginUpdate();
exgraph1.ValueSize = 6;
exgraph1.Data = "C:\\Program Files\\Exontrol\\ExGraph\\Sample\\Data/msft.csv";
exontrol.EXGRAPHLib.Serie var_Serie = exgraph1.Series.Add(null,null);
	var_Serie.Name = "msft";
	var_Serie.Data = "Open,High,Low,Close";
	var_Serie.Type = "candle";
exontrol.EXGRAPHLib.Overview var_Overview = exgraph1.Overview;
	var_Overview.Visible = true;
	exontrol.EXGRAPHLib.LineOptions var_LineOptions = var_Overview.Line;
		var_LineOptions.Color = "red";
		var_LineOptions.Width = 2;
		var_LineOptions.Style = 2;
exgraph1.EndUpdate();
|
|
95
|
Resizes of the control's overview
exgraph1.BeginUpdate();
exgraph1.ValueSize = 6;
exgraph1.Data = "C:\\Program Files\\Exontrol\\ExGraph\\Sample\\Data/msft.csv";
exontrol.EXGRAPHLib.Serie var_Serie = exgraph1.Series.Add(null,null);
	var_Serie.Name = "msft";
	var_Serie.Data = "Open,High,Low,Close";
	var_Serie.Type = "candle";
exontrol.EXGRAPHLib.Overview var_Overview = exgraph1.Overview;
	var_Overview.Visible = true;
	var_Overview.Size = 32;
exgraph1.EndUpdate();
|
|
94
|
Anchors the overview-window
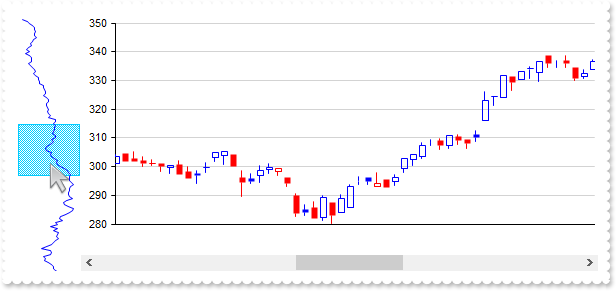
exgraph1.BeginUpdate();
exgraph1.ValueSize = 6;
exgraph1.Data = "C:\\Program Files\\Exontrol\\ExGraph\\Sample\\Data/msft.csv";
exontrol.EXGRAPHLib.Serie var_Serie = exgraph1.Series.Add(null,null);
	var_Serie.Name = "msft";
	var_Serie.Data = "Open,High,Low,Close";
	var_Serie.Type = "candle";
exontrol.EXGRAPHLib.Overview var_Overview = exgraph1.Overview;
	var_Overview.Visible = true;
	var_Overview.Dock = exontrol.EXGRAPHLib.PanelDockEnum.exLeft;
exgraph1.EndUpdate();
|
|
93
|
Shows the overview
exgraph1.BeginUpdate();
exgraph1.ValueSize = 6;
exgraph1.Data = "C:\\Program Files\\Exontrol\\ExGraph\\Sample\\Data/msft.csv";
exontrol.EXGRAPHLib.Serie var_Serie = exgraph1.Series.Add(null,null);
	var_Serie.Name = "msft";
	var_Serie.Data = "Open,High,Low,Close";
	var_Serie.Type = "candle";
exgraph1.Overview.Visible = true;
exgraph1.EndUpdate();
|
|
92
|
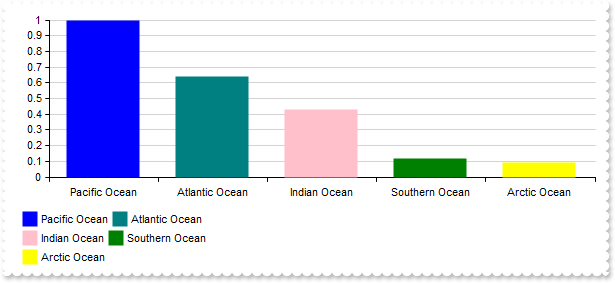
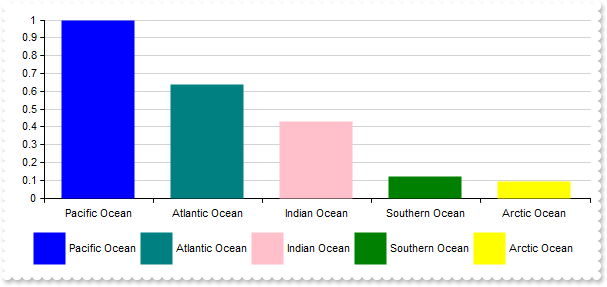
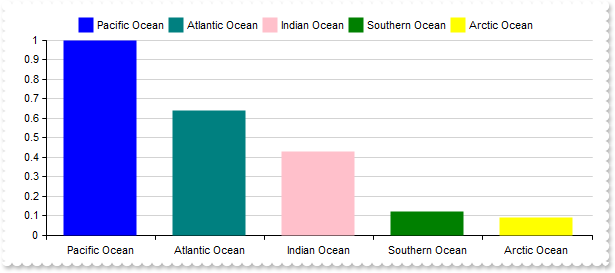
Locks the legend (no value is hidden or shown when user clicks a symbol)
exgraph1.BeginUpdate();
exgraph1.AutoFit = true;
exgraph1.ValueAxis.AsPercent = true;
exgraph1.Series.Add("Pacific Ocean(16525), Atlantic Ocean(10646), Indian Ocean(7056), Southern Ocean(2033), Arctic Ocean(1406)",null);
exontrol.EXGRAPHLib.Legend var_Legend = exgraph1.Legend;
	var_Legend.Visible = true;
	var_Legend.Locked = true;
exgraph1.EndUpdate();
|
|
91
|
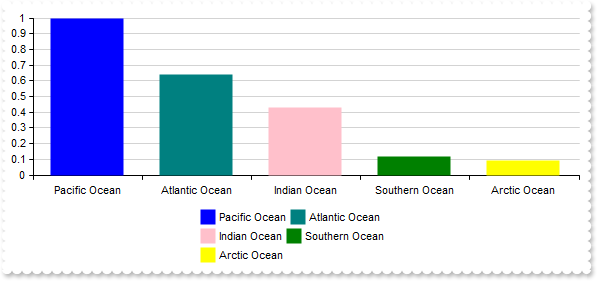
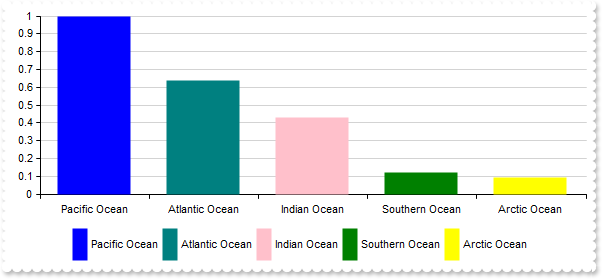
Aligns the legend's content
exgraph1.BeginUpdate();
exgraph1.AutoFit = true;
exgraph1.ValueAxis.AsPercent = true;
exgraph1.Series.Add("Pacific Ocean(16525), Atlantic Ocean(10646), Indian Ocean(7056), Southern Ocean(2033), Arctic Ocean(1406)",null);
exontrol.EXGRAPHLib.Legend var_Legend = exgraph1.Legend;
	var_Legend.Visible = true;
	var_Legend.Grid = "2x";
	var_Legend.Align = exontrol.EXGRAPHLib.LegendAlignEnum.exStart;
exgraph1.EndUpdate();
|
|
90
|
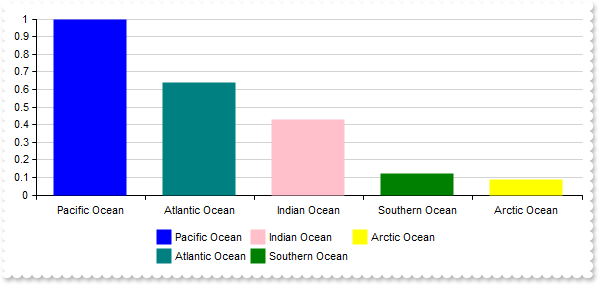
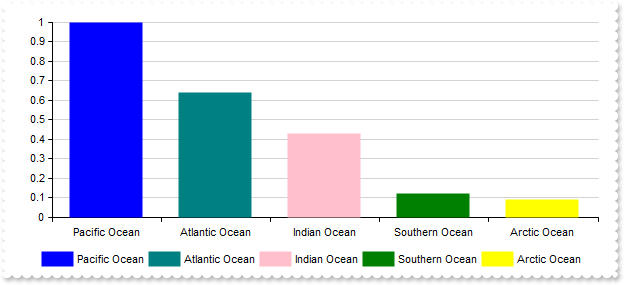
Arranges the legend objects on columns and rows
exgraph1.BeginUpdate();
exgraph1.AutoFit = true;
exgraph1.ValueAxis.AsPercent = true;
exgraph1.Series.Add("Pacific Ocean(16525), Atlantic Ocean(10646), Indian Ocean(7056), Southern Ocean(2033), Arctic Ocean(1406)",null);
exontrol.EXGRAPHLib.Legend var_Legend = exgraph1.Legend;
	var_Legend.Visible = true;
	var_Legend.Grid = "2x";
exgraph1.EndUpdate();
|
|
89
|
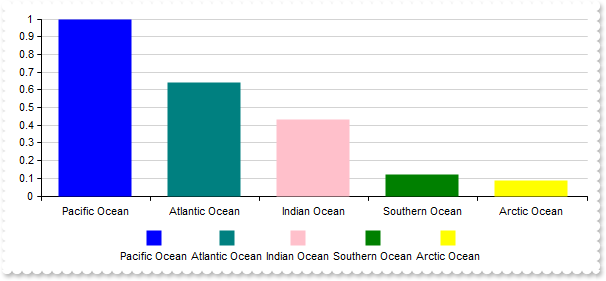
Arranges the legend objects on columns and rows
exgraph1.BeginUpdate();
exgraph1.AutoFit = true;
exgraph1.ValueAxis.AsPercent = true;
exgraph1.Series.Add("Pacific Ocean(16525), Atlantic Ocean(10646), Indian Ocean(7056), Southern Ocean(2033), Arctic Ocean(1406)",null);
exontrol.EXGRAPHLib.Legend var_Legend = exgraph1.Legend;
	var_Legend.Visible = true;
	var_Legend.Flow = exontrol.EXGRAPHLib.LegendFlowEnum.exTopToBottom;
	var_Legend.Grid = "x2";
exgraph1.EndUpdate();
|
|
88
|
Arranges the legend objects from left to right or top to bottom
exgraph1.BeginUpdate();
exgraph1.AutoFit = true;
exgraph1.ValueAxis.AsPercent = true;
exgraph1.Series.Add("Pacific Ocean(16525), Atlantic Ocean(10646), Indian Ocean(7056), Southern Ocean(2033), Arctic Ocean(1406)",null);
exontrol.EXGRAPHLib.Legend var_Legend = exgraph1.Legend;
	var_Legend.Visible = true;
	var_Legend.Flow = exontrol.EXGRAPHLib.LegendFlowEnum.exTopToBottom;
exgraph1.EndUpdate();
|
|
87
|
Defines the size to display the symbol, within the legend
exgraph1.BeginUpdate();
exgraph1.AutoFit = true;
exgraph1.ValueAxis.AsPercent = true;
exgraph1.Series.Add("Pacific Ocean(16525), Atlantic Ocean(10646), Indian Ocean(7056), Southern Ocean(2033), Arctic Ocean(1406)",null);
exontrol.EXGRAPHLib.Legend var_Legend = exgraph1.Legend;
	var_Legend.Visible = true;
	var_Legend.SymbolWidth = 32;
	var_Legend.SymbolHeight = 32;
exgraph1.EndUpdate();
|
|
86
|
Defines the height to display the symbol, within the legend
exgraph1.BeginUpdate();
exgraph1.AutoFit = true;
exgraph1.ValueAxis.AsPercent = true;
exgraph1.Series.Add("Pacific Ocean(16525), Atlantic Ocean(10646), Indian Ocean(7056), Southern Ocean(2033), Arctic Ocean(1406)",null);
exontrol.EXGRAPHLib.Legend var_Legend = exgraph1.Legend;
	var_Legend.Visible = true;
	var_Legend.SymbolHeight = 32;
exgraph1.EndUpdate();
|
|
85
|
Defines the width to display the symbol, within the legend
exgraph1.BeginUpdate();
exgraph1.AutoFit = true;
exgraph1.ValueAxis.AsPercent = true;
exgraph1.Series.Add("Pacific Ocean(16525), Atlantic Ocean(10646), Indian Ocean(7056), Southern Ocean(2033), Arctic Ocean(1406)",null);
exontrol.EXGRAPHLib.Legend var_Legend = exgraph1.Legend;
	var_Legend.Visible = true;
	var_Legend.SymbolWidth = 32;
exgraph1.EndUpdate();
|
|
84
|
Aligns the symbol of the serie relative to the label of the serie, within the legend
exgraph1.BeginUpdate();
exgraph1.AutoFit = true;
exgraph1.ValueAxis.AsPercent = true;
exgraph1.Series.Add("Pacific Ocean(16525), Atlantic Ocean(10646), Indian Ocean(7056), Southern Ocean(2033), Arctic Ocean(1406)",null);
exontrol.EXGRAPHLib.Legend var_Legend = exgraph1.Legend;
	var_Legend.Visible = true;
	var_Legend.SymbolAlign = exontrol.EXGRAPHLib.LegendSymbolAlignmentEnum.exSymbolCenter | exontrol.EXGRAPHLib.LegendSymbolAlignmentEnum.exSymbolTop;
exgraph1.EndUpdate();
|
|
83
|
Displays the labels using a fixed-size
exgraph1.BeginUpdate();
exgraph1.AutoFit = true;
exgraph1.ValueAxis.AsPercent = true;
exgraph1.Series.Add("Pacific Ocean(16525), Atlantic Ocean(10646), Indian Ocean(7056), Southern Ocean(2033), Arctic Ocean(1406)",null);
exontrol.EXGRAPHLib.Legend var_Legend = exgraph1.Legend;
	var_Legend.Visible = true;
	var_Legend.FormatText = exontrol.EXGRAPHLib.DrawTextFormatEnum.exTextWordBreak;
	var_Legend.LabelFixedWidth = 48;
	var_Legend.LabelFixedHeight = 32;
exgraph1.EndUpdate();
|
|
82
|
Displays the labels using a fixed-height
exgraph1.BeginUpdate();
exgraph1.AutoFit = true;
exgraph1.ValueAxis.AsPercent = true;
exgraph1.Series.Add("Pacific Ocean(16525), Atlantic Ocean(10646), Indian Ocean(7056), Southern Ocean(2033), Arctic Ocean(1406)",null);
exontrol.EXGRAPHLib.Legend var_Legend = exgraph1.Legend;
	var_Legend.Visible = true;
	var_Legend.FormatText = exontrol.EXGRAPHLib.DrawTextFormatEnum.exTextAlignVCenter;
	var_Legend.LabelFixedHeight = 32;
	var_Legend.Dock = exontrol.EXGRAPHLib.PanelDockEnum.exLeft;
exgraph1.EndUpdate();
|
|
81
|
Displays the labels using a fixed-width
exgraph1.BeginUpdate();
exgraph1.AutoFit = true;
exgraph1.ValueAxis.AsPercent = true;
exgraph1.Series.Add("Pacific Ocean(16525), Atlantic Ocean(10646), Indian Ocean(7056), Southern Ocean(2033), Arctic Ocean(1406)",null);
exontrol.EXGRAPHLib.Legend var_Legend = exgraph1.Legend;
	var_Legend.Visible = true;
	var_Legend.FormatText = exontrol.EXGRAPHLib.DrawTextFormatEnum.exTextEndEllipsis;
	var_Legend.LabelFixedWidth = 32;
exgraph1.EndUpdate();
|
|
80
|
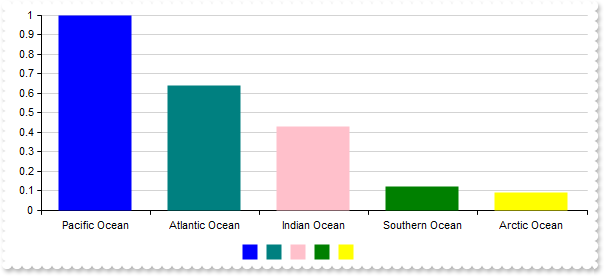
Hides the labels on the legend (method 2)
exgraph1.BeginUpdate();
exgraph1.AutoFit = true;
exgraph1.ValueAxis.AsPercent = true;
exgraph1.Series.Add("Pacific Ocean(16525), Atlantic Ocean(10646), Indian Ocean(7056), Southern Ocean(2033), Arctic Ocean(1406)",null).LegendFormat = "``";
exgraph1.Legend.Visible = true;
exgraph1.EndUpdate();
|
|
79
|
Hides the labels on the legend (method 1)
exgraph1.BeginUpdate();
exgraph1.AutoFit = true;
exgraph1.ValueAxis.AsPercent = true;
exgraph1.Series.Add("Pacific Ocean(16525), Atlantic Ocean(10646), Indian Ocean(7056), Southern Ocean(2033), Arctic Ocean(1406)",null);
exontrol.EXGRAPHLib.Legend var_Legend = exgraph1.Legend;
	var_Legend.Visible = true;
	var_Legend.FormatText = exontrol.EXGRAPHLib.DrawTextFormatEnum.exTextCalcRect;
	var_Legend.LabelFixedWidth = 1;
exgraph1.EndUpdate();
|
|
78
|
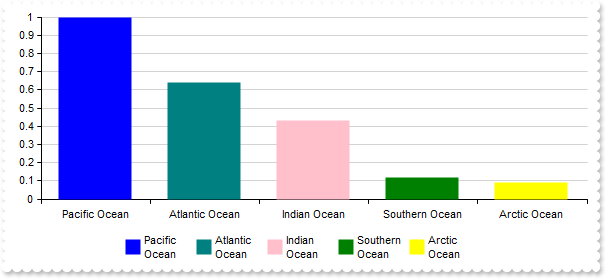
Specifies the flags the labels use to display on the legend (for instance, displays the labels on multiple lines)
exgraph1.BeginUpdate();
exgraph1.AutoFit = true;
exgraph1.ValueAxis.AsPercent = true;
exgraph1.Series.Add("Pacific Ocean(16525), Atlantic Ocean(10646), Indian Ocean(7056), Southern Ocean(2033), Arctic Ocean(1406)",null);
exontrol.EXGRAPHLib.Legend var_Legend = exgraph1.Legend;
	var_Legend.Visible = true;
	var_Legend.FormatText = exontrol.EXGRAPHLib.DrawTextFormatEnum.exTextWordBreak;
	var_Legend.LabelFixedWidth = 48;
exgraph1.EndUpdate();
|
|
77
|
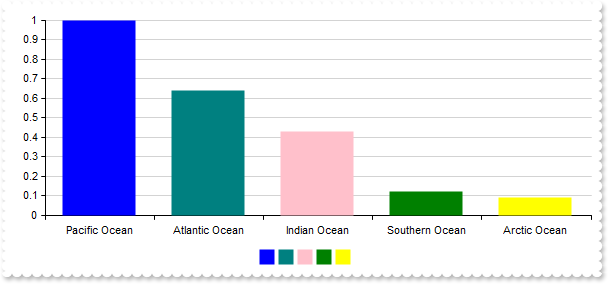
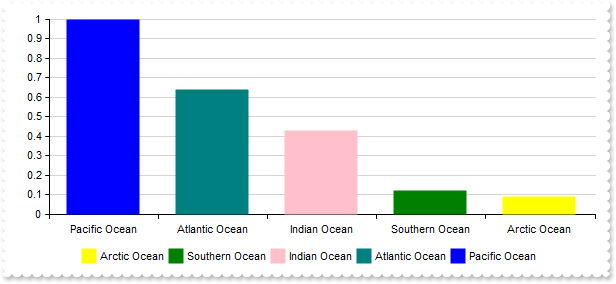
Reverses the order of the items within the legend
exgraph1.BeginUpdate();
exgraph1.AutoFit = true;
exgraph1.ValueAxis.AsPercent = true;
exgraph1.Series.Add("Pacific Ocean(16525), Atlantic Ocean(10646), Indian Ocean(7056), Southern Ocean(2033), Arctic Ocean(1406)",null);
exontrol.EXGRAPHLib.Legend var_Legend = exgraph1.Legend;
	var_Legend.Visible = true;
	var_Legend.Reverse = true;
exgraph1.EndUpdate();
|
|
76
|
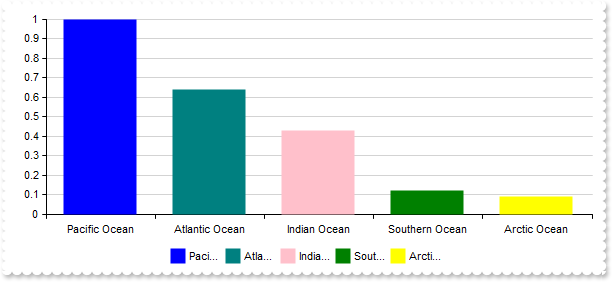
Defines the legend's padding (space between legend's symbol/label and its borders)
exgraph1.BeginUpdate();
exgraph1.AutoFit = true;
exgraph1.ValueAxis.AsPercent = true;
exgraph1.Series.Add("Pacific Ocean(16525), Atlantic Ocean(10646), Indian Ocean(7056), Southern Ocean(2033), Arctic Ocean(1406)",null);
exontrol.EXGRAPHLib.Legend var_Legend = exgraph1.Legend;
	var_Legend.Visible = true;
	var_Legend.Pad = "12,0";
exgraph1.EndUpdate();
|
|
75
|
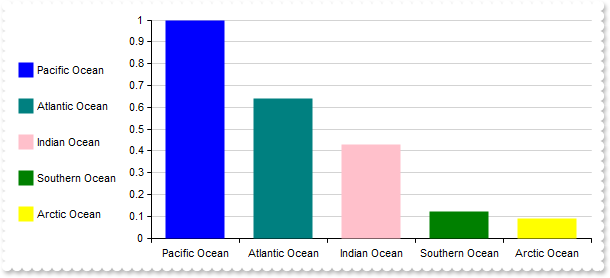
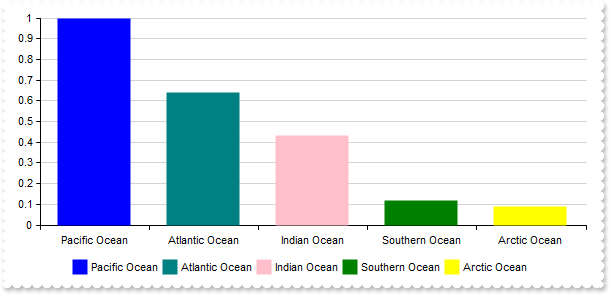
Specifies the edge of the container the legend-window is anchored to
exgraph1.BeginUpdate();
exgraph1.AutoFit = true;
exgraph1.ValueAxis.AsPercent = true;
exgraph1.Series.Add("Pacific Ocean(16525), Atlantic Ocean(10646), Indian Ocean(7056), Southern Ocean(2033), Arctic Ocean(1406)",null);
exontrol.EXGRAPHLib.Legend var_Legend = exgraph1.Legend;
	var_Legend.Visible = true;
	var_Legend.Dock = exontrol.EXGRAPHLib.PanelDockEnum.exTop;
exgraph1.EndUpdate();
|
|
74
|
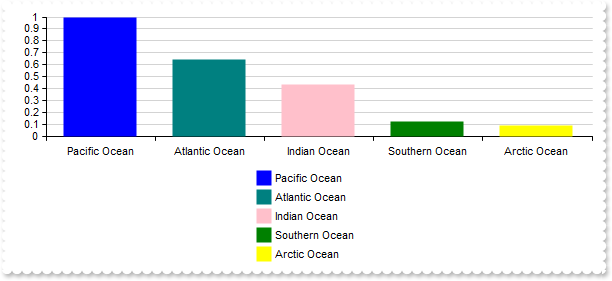
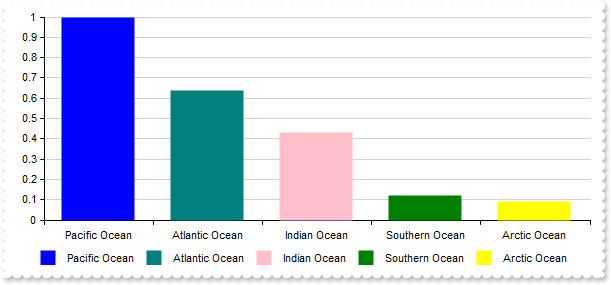
Show the legend
exgraph1.BeginUpdate();
exgraph1.AutoFit = true;
exgraph1.ValueAxis.AsPercent = true;
exgraph1.Series.Add("Pacific Ocean(16525), Atlantic Ocean(10646), Indian Ocean(7056), Southern Ocean(2033), Arctic Ocean(1406)",null);
exgraph1.Legend.Visible = true;
exgraph1.EndUpdate();
|
|
73
|
Defines the tooltip's padding (space between tooltip's caption and its borders), for tooltips when cursor hovers the chart
exgraph1.BeginUpdate();
exgraph1.AutoFit = true;
exgraph1.Series.Add("Asia(4600), Africa(1300), Europe(747), North America(579), South America(431), Australia/Oceania(42)",null);
exgraph1.Series.Add("Asia(4458), Africa(3037), North America(2470), South America(1784), Antarctica(1400), Europe(1018), Australia/Oceania(856)",null);
exontrol.EXGRAPHLib.Cursor var_Cursor = exgraph1.Cursor;
	var_Cursor.Visible = true;
	var_Cursor.TooltipPad = "8,8";
exgraph1.EndUpdate();
|
|
72
|
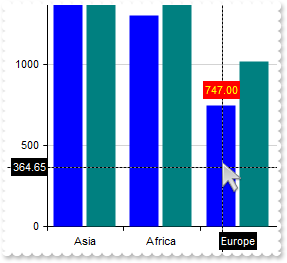
Defines the foreground and background colors to show the tooltips on values
exgraph1.BeginUpdate();
exgraph1.AutoFit = true;
exgraph1.Series.Add("Asia(4600), Africa(1300), Europe(747), North America(579), South America(431), Australia/Oceania(42)",null);
exgraph1.Series.Add("Asia(4458), Africa(3037), North America(2470), South America(1784), Antarctica(1400), Europe(1018), Australia/Oceania(856)",null);
exontrol.EXGRAPHLib.Cursor var_Cursor = exgraph1.Cursor;
	var_Cursor.Visible = true;
	var_Cursor.SerieTooltipBackColor = "red";
	var_Cursor.SerieTooltipForeColor = "yellow";
exgraph1.EndUpdate();
|
|
71
|
Defines the foreground and background colors to show the tooltips on axes
exgraph1.BeginUpdate();
exgraph1.AutoFit = true;
exgraph1.Series.Add("Asia(4600), Africa(1300), Europe(747), North America(579), South America(431), Australia/Oceania(42)",null);
exgraph1.Series.Add("Asia(4458), Africa(3037), North America(2470), South America(1784), Antarctica(1400), Europe(1018), Australia/Oceania(856)",null);
exontrol.EXGRAPHLib.Cursor var_Cursor = exgraph1.Cursor;
	var_Cursor.Visible = true;
	var_Cursor.AxisTooltipBackColor = "red";
	var_Cursor.AxisTooltipForeColor = "yellow";
exgraph1.EndUpdate();
|
|
70
|
Defines the color, width or style of line to display the crosshair over the hover/touch area (showCursorCategoryLine or showCursorValueLine)
exgraph1.BeginUpdate();
exgraph1.AutoFit = true;
exgraph1.Series.Add("Asia(4600), Africa(1300), Europe(747), North America(579), South America(431), Australia/Oceania(42)",null);
exgraph1.Series.Add("Asia(4458), Africa(3037), North America(2470), South America(1784), Antarctica(1400), Europe(1018), Australia/Oceania(856)",null);
exontrol.EXGRAPHLib.Cursor var_Cursor = exgraph1.Cursor;
	var_Cursor.Visible = true;
	exontrol.EXGRAPHLib.LineOptions var_LineOptions = var_Cursor.Line;
		var_LineOptions.Color = "red";
		var_LineOptions.Style = 0;
		var_LineOptions.Width = 2;
exgraph1.EndUpdate();
|
|
69
|
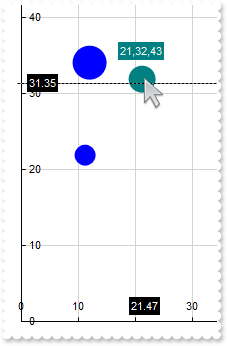
Hides the horizontal x-line, when the crosshair cursor hovers the chart (available for xy-chart types only)
exgraph1.BeginUpdate();
exontrol.EXGRAPHLib.Serie var_Serie = exgraph1.Series.Add("11 22 33,44 55 66,77 88 99,12 34 56,78 90 23",null);
	var_Serie.Type = "bubble";
	var_Serie.set_Misc(exontrol.EXGRAPHLib.SerieMiscEnum.exScatterPlotSize,64);
exontrol.EXGRAPHLib.Serie var_Serie1 = exgraph1.Series.Add("21 32 43,54 65 76,87 98 09,45 67 89,90 23 45",null);
	var_Serie1.Type = "bubble";
	var_Serie1.set_Misc(exontrol.EXGRAPHLib.SerieMiscEnum.exScatterPlotSize,64);
exontrol.EXGRAPHLib.Cursor var_Cursor = exgraph1.Cursor;
	var_Cursor.Visible = true;
	var_Cursor.ShowCursorYLine = false;
exgraph1.EndUpdate();
|
|
68
|
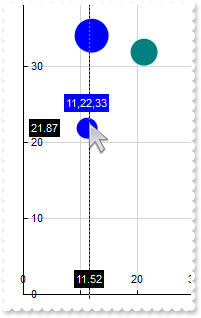
Hides the vertical y-line, when the crosshair cursor hovers the chart (available for xy-chart types only)
exgraph1.BeginUpdate();
exontrol.EXGRAPHLib.Serie var_Serie = exgraph1.Series.Add("11 22 33,44 55 66,77 88 99,12 34 56,78 90 23",null);
	var_Serie.Type = "bubble";
	var_Serie.set_Misc(exontrol.EXGRAPHLib.SerieMiscEnum.exScatterPlotSize,64);
exontrol.EXGRAPHLib.Serie var_Serie1 = exgraph1.Series.Add("21 32 43,54 65 76,87 98 09,45 67 89,90 23 45",null);
	var_Serie1.Type = "bubble";
	var_Serie1.set_Misc(exontrol.EXGRAPHLib.SerieMiscEnum.exScatterPlotSize,64);
exontrol.EXGRAPHLib.Cursor var_Cursor = exgraph1.Cursor;
	var_Cursor.Visible = true;
	var_Cursor.ShowCursorXLine = false;
exgraph1.EndUpdate();
|
|
67
|
Hides the horizontal/vertical value/y-line, when the crosshair cursor hovers the chart
exgraph1.BeginUpdate();
exgraph1.AutoFit = true;
exgraph1.Series.Add("Asia(4600), Africa(1300), Europe(747), North America(579), South America(431), Australia/Oceania(42)",null);
exontrol.EXGRAPHLib.Cursor var_Cursor = exgraph1.Cursor;
	var_Cursor.Visible = true;
	var_Cursor.ShowCursorValueLine = false;
exgraph1.EndUpdate();
|
|
66
|
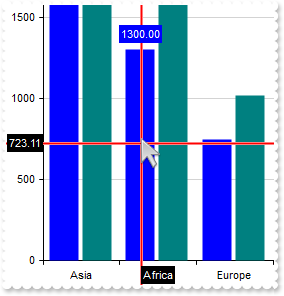
Displays all tooltips for all series of the category unit being indicated by the vertical/horizontal category/x-line
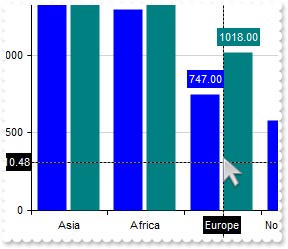
exgraph1.BeginUpdate();
exgraph1.AutoFit = true;
exgraph1.Series.Add("Asia(4600), Africa(1300), Europe(747), North America(579), South America(431), Australia/Oceania(42)",null);
exgraph1.Series.Add("Asia(4458), Africa(3037), North America(2470), South America(1784), Antarctica(1400), Europe(1018), Australia/Oceania(856)",null);
exontrol.EXGRAPHLib.Cursor var_Cursor = exgraph1.Cursor;
	var_Cursor.Visible = true;
	var_Cursor.ShowCursorSerieTooltip = exontrol.EXGRAPHLib.ShowCursorSerieTooltipEnum.exCursorSerieShowAll;
exgraph1.EndUpdate();
|
|
65
|
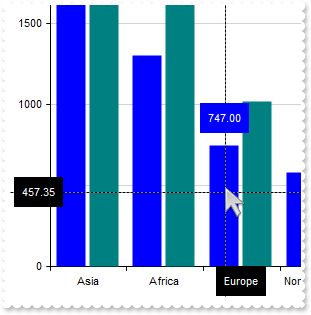
The pointer indicates the series whose tooltip is displayed, when the crosshair cursor hovers its chart
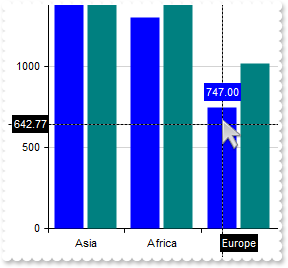
exgraph1.BeginUpdate();
exgraph1.AutoFit = true;
exgraph1.Series.Add("Asia(4600), Africa(1300), Europe(747), North America(579), South America(431), Australia/Oceania(42)",null);
exgraph1.Series.Add("Asia(4458), Africa(3037), North America(2470), South America(1784), Antarctica(1400), Europe(1018), Australia/Oceania(856)",null);
exontrol.EXGRAPHLib.Cursor var_Cursor = exgraph1.Cursor;
	var_Cursor.Visible = true;
	var_Cursor.ShowCursorSerieTooltip = exontrol.EXGRAPHLib.ShowCursorSerieTooltipEnum.exCursorSerieShowExact;
exgraph1.EndUpdate();
|
|
64
|
Hides the tooltip when the crosshair cursor hovers the chart
exgraph1.BeginUpdate();
exgraph1.AutoFit = true;
exgraph1.Series.Add("Asia(4600), Africa(1300), Europe(747), North America(579), South America(431), Australia/Oceania(42)",null);
exgraph1.Series.Add("Asia(4458), Africa(3037), North America(2470), South America(1784), Antarctica(1400), Europe(1018), Australia/Oceania(856)",null);
exontrol.EXGRAPHLib.Cursor var_Cursor = exgraph1.Cursor;
	var_Cursor.Visible = true;
	var_Cursor.ShowCursorSerieTooltip = exontrol.EXGRAPHLib.ShowCursorSerieTooltipEnum.exCursorSerieHide;
exgraph1.EndUpdate();
|
|
63
|
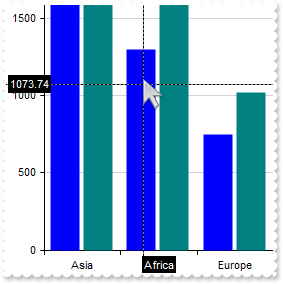
Shows the category/x-line when the cursor is near the value
exgraph1.BeginUpdate();
exgraph1.AutoFit = true;
exgraph1.Series.Add("Asia(4600), Africa(1300), Europe(747), North America(579), South America(431), Australia/Oceania(42)",null);
exontrol.EXGRAPHLib.Cursor var_Cursor = exgraph1.Cursor;
	var_Cursor.Visible = true;
	var_Cursor.ShowCursorCategoryLine = exontrol.EXGRAPHLib.ShowCursorCategoryLineEnum.exCursorCategoryShowNear;
exgraph1.EndUpdate();
|
|
62
|
Hides the cursor's category/x-line
exgraph1.BeginUpdate();
exgraph1.AutoFit = true;
exgraph1.Series.Add("Asia(4600), Africa(1300), Europe(747), North America(579), South America(431), Australia/Oceania(42)",null);
exontrol.EXGRAPHLib.Cursor var_Cursor = exgraph1.Cursor;
	var_Cursor.Visible = true;
	var_Cursor.ShowCursorCategoryLine = exontrol.EXGRAPHLib.ShowCursorCategoryLineEnum.exCursorCategoryHide;
exgraph1.EndUpdate();
|
|
61
|
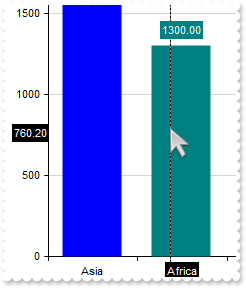
How can I show the values from the cursor
exgraph1.BeginUpdate();
exgraph1.AutoFit = true;
exgraph1.Series.Add("Asia(4600), Africa(1300), Europe(747), North America(579), South America(431), Australia/Oceania(42)",null);
exgraph1.Cursor.Visible = true;
exgraph1.EndUpdate();
|
|
60
|
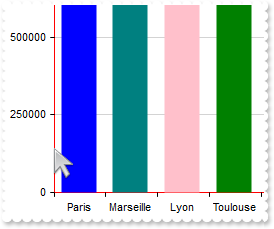
Defines the style to display the axis-line
exgraph1.BeginUpdate();
exgraph1.ValueAxis.AxisLine.Style = 2;
exgraph1.CategoryAxis.AxisLine.Style = 2;
exgraph1.AutoFit = true;
exgraph1.Series.Add("Paris(2148271),Marseille(1748148),Lyon(1637677),Toulouse(1360829),Nice(1000548),Nantes(973133),Strasbourg(785839),Montpellier(5" +
"90741),Bordeaux(589649),Lille(484786)",null);
exgraph1.EndUpdate();
|
|
59
|
Defines the color to show the axis
exgraph1.BeginUpdate();
exgraph1.ValueAxis.AxisLine.Color = "red";
exgraph1.CategoryAxis.AxisLine.Color = "red";
exgraph1.AutoFit = true;
exgraph1.Series.Add("Paris(2148271),Marseille(1748148),Lyon(1637677),Toulouse(1360829),Nice(1000548),Nantes(973133),Strasbourg(785839),Montpellier(5" +
"90741),Bordeaux(589649),Lille(484786)",null);
exgraph1.EndUpdate();
|
|
58
|
Specifies the step to show the ticks for value or category axes
exgraph1.BeginUpdate();
exgraph1.ValueAxis.MajorTicks.Step = 2;
exgraph1.AutoFit = true;
exgraph1.Series.Add("Berlin(3769495),Hamburg(1847253),Munich(1471508),Cologne(1085664),Frankfurt(753056),Stuttgart(731374),D�sseldorf(620877),Dortmu" +
"nd(586600),Essen(582760),Bremen(565719)",null);
exgraph1.Sort = "0:D";
exgraph1.EndUpdate();
|
|
57
|
Specifies the number of ticks to skip for value or category axes
exgraph1.BeginUpdate();
exgraph1.ValueAxis.MajorTicks.Skip = 3;
exgraph1.AutoFit = true;
exgraph1.Series.Add("Berlin(3769495),Hamburg(1847253),Munich(1471508),Cologne(1085664),Frankfurt(753056),Stuttgart(731374),D�sseldorf(620877),Dortmu" +
"nd(586600),Essen(582760),Bremen(565719)",null);
exgraph1.Sort = "0:D";
exgraph1.EndUpdate();
|
|
56
|
Defines the style to show the major-ticks of value or category axes
exgraph1.BeginUpdate();
exontrol.EXGRAPHLib.TickOptions var_TickOptions = exgraph1.ValueAxis.MajorTicks;
var_TickOptions.Style = 1;
var_TickOptions.Width = 3;
exgraph1.AutoFit = true;
exgraph1.Series.Add("Berlin(3769495),Hamburg(1847253),Munich(1471508),Cologne(1085664),Frankfurt(753056),Stuttgart(731374),D�sseldorf(620877),Dortmu" +
"nd(586600),Essen(582760),Bremen(565719)",null);
exgraph1.Sort = "0:D";
exgraph1.EndUpdate();
|
|
55
|
Defines the color to show the major-ticks of value or category axes
exgraph1.BeginUpdate();
exontrol.EXGRAPHLib.TickOptions var_TickOptions = exgraph1.ValueAxis.MajorTicks;
var_TickOptions.Color = "red";
var_TickOptions.Width = 3;
exgraph1.AutoFit = true;
exgraph1.Series.Add("Berlin(3769495),Hamburg(1847253),Munich(1471508),Cologne(1085664),Frankfurt(753056),Stuttgart(731374),D�sseldorf(620877),Dortmu" +
"nd(586600),Essen(582760),Bremen(565719)",null);
exgraph1.Sort = "0:D";
exgraph1.EndUpdate();
|
|
54
|
Specifies the size to show the major-ticks of value or category axes
exgraph1.BeginUpdate();
exgraph1.ValueAxis.MajorTicks.Width = 3;
exgraph1.AutoFit = true;
exgraph1.Series.Add("Berlin(3769495),Hamburg(1847253),Munich(1471508),Cologne(1085664),Frankfurt(753056),Stuttgart(731374),D�sseldorf(620877),Dortmu" +
"nd(586600),Essen(582760),Bremen(565719)",null);
exgraph1.Sort = "0:D";
exgraph1.EndUpdate();
|
|
53
|
Defines the step to show the major-grid lines, for value or category axes
exgraph1.BeginUpdate();
exgraph1.ValueAxis.MajorGridLines.Step = 2;
exgraph1.AutoFit = true;
exgraph1.Series.Add("Bucharest(1883425),Cluj-Napoca(316748),Timisoara(319279),Iasi(382484),Constanta(283872),Brasov(253200),Galati(249432),Craiova(2" +
"69506),Ploiesti(209945),Oradea(222239)",null);
exgraph1.Sort = "0:D";
exgraph1.EndUpdate();
|
|
52
|
Specifies the number of major grid-line's to skip, for value or category axes
exgraph1.BeginUpdate();
exgraph1.ValueAxis.MajorGridLines.Skip = 3;
exgraph1.AutoFit = true;
exgraph1.Series.Add("Bucharest(1883425),Cluj-Napoca(316748),Timisoara(319279),Iasi(382484),Constanta(283872),Brasov(253200),Galati(249432),Craiova(2" +
"69506),Ploiesti(209945),Oradea(222239)",null);
exgraph1.Sort = "0:D";
exgraph1.EndUpdate();
|
|
51
|
Specifies the style of the major grid-line (dash, dot, ...), for value or category axes
exgraph1.BeginUpdate();
exgraph1.ValueAxis.MajorGridLines.Style = 2;
exgraph1.AutoFit = true;
exgraph1.Series.Add("Bucharest(1883425),Cluj-Napoca(316748),Timisoara(319279),Iasi(382484),Constanta(283872),Brasov(253200),Galati(249432),Craiova(2" +
"69506),Ploiesti(209945),Oradea(222239)",null);
exgraph1.Sort = "0:D";
exgraph1.EndUpdate();
|
|
50
|
Specifies the major grid-line's color, for value or category axes
exgraph1.BeginUpdate();
exgraph1.ValueAxis.MajorGridLines.Color = "red";
exgraph1.AutoFit = true;
exgraph1.Series.Add("Bucharest(1883425),Cluj-Napoca(316748),Timisoara(319279),Iasi(382484),Constanta(283872),Brasov(253200),Galati(249432),Craiova(2" +
"69506),Ploiesti(209945),Oradea(222239)",null);
exgraph1.Sort = "0:D";
exgraph1.EndUpdate();
|
|
49
|
Specifies the major grid-line's width or size, for value or category axes
exgraph1.BeginUpdate();
exgraph1.ValueAxis.MajorGridLines.Width = 2;
exgraph1.AutoFit = true;
exgraph1.Series.Add("Bucharest(1883425),Cluj-Napoca(316748),Timisoara(319279),Iasi(382484),Constanta(283872),Brasov(253200),Galati(249432),Craiova(2" +
"69506),Ploiesti(209945),Oradea(222239)",null);
exgraph1.Sort = "0:D";
exgraph1.EndUpdate();
|
|
48
|
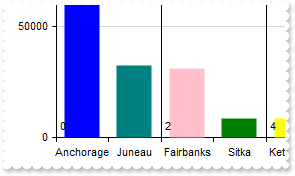
Hide the labels of the grid lines (chart, overview)
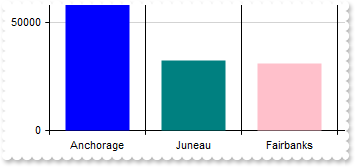
exgraph1.BeginUpdate();
exgraph1.ValueSize = 64;
exontrol.EXGRAPHLib.CategoryAxis var_CategoryAxis = exgraph1.CategoryAxis;
	var_CategoryAxis.Categories = "Anchorage,Juneau,Fairbanks,Sitka,Ketchikan,Wasilla,Kenai,Kodiak,Bethel,Palmer";
	exontrol.EXGRAPHLib.FormatGridLinesOptions var_FormatGridLinesOptions = var_CategoryAxis.ChartGridLines;
		var_FormatGridLinesOptions.Color = "black";
		var_FormatGridLinesOptions.Format = "value";
		var_FormatGridLinesOptions.Align = exontrol.EXGRAPHLib.DrawTextFormatEnum.exTextCalcRect;
exgraph1.Series.Add("291247,32269,30917,8588,8208,10529,7757,5968,6481,7393",null);
exgraph1.EndUpdate();
|
|
47
|
Aligns the labels of the grid lines (chart, overview)
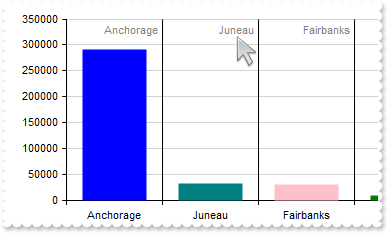
exgraph1.BeginUpdate();
exgraph1.ValueSize = 64;
exontrol.EXGRAPHLib.CategoryAxis var_CategoryAxis = exgraph1.CategoryAxis;
	var_CategoryAxis.Categories = "Anchorage,Juneau,Fairbanks,Sitka,Ketchikan,Wasilla,Kenai,Kodiak,Bethel,Palmer";
	exontrol.EXGRAPHLib.FormatGridLinesOptions var_FormatGridLinesOptions = var_CategoryAxis.ChartGridLines;
		var_FormatGridLinesOptions.Color = "black";
		var_FormatGridLinesOptions.Format = "`<fgcolor gray>` + value";
		var_FormatGridLinesOptions.Align = exontrol.EXGRAPHLib.DrawTextFormatEnum.exTextNoClip | exontrol.EXGRAPHLib.DrawTextFormatEnum.exTextAlignRight;
exgraph1.Series.Add("291247,32269,30917,8588,8208,10529,7757,5968,6481,7393",null);
exgraph1.EndUpdate();
|
|
46
|
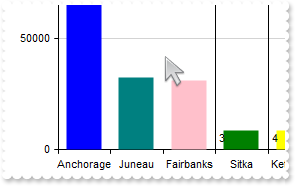
Defines where the grid lines appear on chart or overview
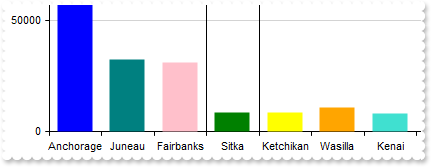
exgraph1.BeginUpdate();
exgraph1.AutoFit = true;
exontrol.EXGRAPHLib.CategoryAxis var_CategoryAxis = exgraph1.CategoryAxis;
	var_CategoryAxis.Categories = "Anchorage,Juneau,Fairbanks,Sitka,Ketchikan,Wasilla,Kenai,Kodiak,Bethel,Palmer";
	exontrol.EXGRAPHLib.FormatGridLinesOptions var_FormatGridLinesOptions = var_CategoryAxis.ChartGridLines;
		var_FormatGridLinesOptions.Color = "black";
		var_FormatGridLinesOptions.Format = "value = `Sitka`";
		var_FormatGridLinesOptions.Align = exontrol.EXGRAPHLib.DrawTextFormatEnum.exTextCalcRect;
exgraph1.Series.Add("291247,32269,30917,8588,8208,10529,7757,5968,6481,7393",null);
exgraph1.EndUpdate();
|
|
45
|
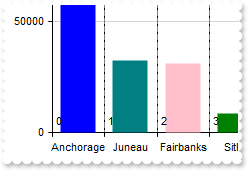
Defines the labels between grid lines (chart, overview)
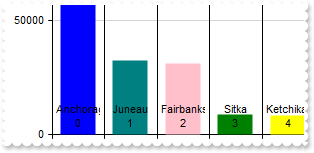
exgraph1.BeginUpdate();
exgraph1.AutoFit = true;
exontrol.EXGRAPHLib.CategoryAxis var_CategoryAxis = exgraph1.CategoryAxis;
	var_CategoryAxis.Format = "``";
	var_CategoryAxis.Categories = "Anchorage,Juneau,Fairbanks,Sitka,Ketchikan,Wasilla,Kenai,Kodiak,Bethel,Palmer";
	exontrol.EXGRAPHLib.FormatGridLinesOptions var_FormatGridLinesOptions = var_CategoryAxis.ChartGridLines;
		var_FormatGridLinesOptions.Color = "black";
		var_FormatGridLinesOptions.Format = "`<c>` + value + `<br><c>` + index";
exgraph1.Series.Add("291247,32269,30917,8588,8208,10529,7757,5968,6481,7393",null);
exgraph1.EndUpdate();
|
|
44
|
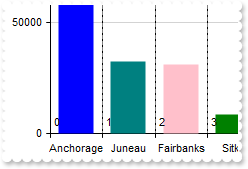
Defines the step to show the grid lines (chart, overview)
exgraph1.BeginUpdate();
exgraph1.AutoFit = true;
exontrol.EXGRAPHLib.CategoryAxis var_CategoryAxis = exgraph1.CategoryAxis;
	var_CategoryAxis.Categories = "Anchorage,Juneau,Fairbanks,Sitka,Ketchikan,Wasilla,Kenai,Kodiak,Bethel,Palmer";
	exontrol.EXGRAPHLib.FormatGridLinesOptions var_FormatGridLinesOptions = var_CategoryAxis.ChartGridLines;
		var_FormatGridLinesOptions.Color = "black";
		var_FormatGridLinesOptions.Format = "index";
		var_FormatGridLinesOptions.Step = 2;
exgraph1.Series.Add("291247,32269,30917,8588,8208,10529,7757,5968,6481,7393",null);
exgraph1.EndUpdate();
|
|
43
|
Specifies the number of grid lines to skip (chart, overview)
exgraph1.BeginUpdate();
exgraph1.AutoFit = true;
exontrol.EXGRAPHLib.CategoryAxis var_CategoryAxis = exgraph1.CategoryAxis;
	var_CategoryAxis.Categories = "Anchorage,Juneau,Fairbanks,Sitka,Ketchikan,Wasilla,Kenai,Kodiak,Bethel,Palmer";
	exontrol.EXGRAPHLib.FormatGridLinesOptions var_FormatGridLinesOptions = var_CategoryAxis.ChartGridLines;
		var_FormatGridLinesOptions.Color = "black";
		var_FormatGridLinesOptions.Format = "index";
		var_FormatGridLinesOptions.Skip = 3;
exgraph1.Series.Add("291247,32269,30917,8588,8208,10529,7757,5968,6481,7393",null);
exgraph1.EndUpdate();
|
|
42
|
Defines the grid-line dash-dot-dot-style (chart, overview)
exgraph1.BeginUpdate();
exgraph1.AutoFit = true;
exontrol.EXGRAPHLib.CategoryAxis var_CategoryAxis = exgraph1.CategoryAxis;
	var_CategoryAxis.Categories = "Anchorage,Juneau,Fairbanks,Sitka,Ketchikan,Wasilla,Kenai,Kodiak,Bethel,Palmer";
	exontrol.EXGRAPHLib.FormatGridLinesOptions var_FormatGridLinesOptions = var_CategoryAxis.ChartGridLines;
		var_FormatGridLinesOptions.Color = "black";
		var_FormatGridLinesOptions.Style = 4;
		var_FormatGridLinesOptions.Format = "index";
exgraph1.Series.Add("291247,32269,30917,8588,8208,10529,7757,5968,6481,7393",null);
exgraph1.EndUpdate();
|
|
41
|
Defines the grid-line dash-dot-style (chart, overview)
exgraph1.BeginUpdate();
exgraph1.AutoFit = true;
exontrol.EXGRAPHLib.CategoryAxis var_CategoryAxis = exgraph1.CategoryAxis;
	var_CategoryAxis.Categories = "Anchorage,Juneau,Fairbanks,Sitka,Ketchikan,Wasilla,Kenai,Kodiak,Bethel,Palmer";
	exontrol.EXGRAPHLib.FormatGridLinesOptions var_FormatGridLinesOptions = var_CategoryAxis.ChartGridLines;
		var_FormatGridLinesOptions.Color = "black";
		var_FormatGridLinesOptions.Style = 3;
		var_FormatGridLinesOptions.Format = "index";
exgraph1.Series.Add("291247,32269,30917,8588,8208,10529,7757,5968,6481,7393",null);
exgraph1.EndUpdate();
|
|
40
|
Defines the grid-line dot-style (chart, overview)
exgraph1.BeginUpdate();
exgraph1.AutoFit = true;
exontrol.EXGRAPHLib.CategoryAxis var_CategoryAxis = exgraph1.CategoryAxis;
	var_CategoryAxis.Categories = "Anchorage,Juneau,Fairbanks,Sitka,Ketchikan,Wasilla,Kenai,Kodiak,Bethel,Palmer";
	exontrol.EXGRAPHLib.FormatGridLinesOptions var_FormatGridLinesOptions = var_CategoryAxis.ChartGridLines;
		var_FormatGridLinesOptions.Color = "black";
		var_FormatGridLinesOptions.Style = 2;
		var_FormatGridLinesOptions.Format = "index";
exgraph1.Series.Add("291247,32269,30917,8588,8208,10529,7757,5968,6481,7393",null);
exgraph1.EndUpdate();
|
|
39
|
Defines the grid-line dash-style (chart, overview)
exgraph1.BeginUpdate();
exgraph1.AutoFit = true;
exontrol.EXGRAPHLib.CategoryAxis var_CategoryAxis = exgraph1.CategoryAxis;
	var_CategoryAxis.Categories = "Anchorage,Juneau,Fairbanks,Sitka,Ketchikan,Wasilla,Kenai,Kodiak,Bethel,Palmer";
	exontrol.EXGRAPHLib.FormatGridLinesOptions var_FormatGridLinesOptions = var_CategoryAxis.ChartGridLines;
		var_FormatGridLinesOptions.Color = "black";
		var_FormatGridLinesOptions.Style = 1;
		var_FormatGridLinesOptions.Format = "index";
exgraph1.Series.Add("291247,32269,30917,8588,8208,10529,7757,5968,6481,7393",null);
exgraph1.EndUpdate();
|
|
38
|
Specifies the grid-line's color (chart, overview)
exgraph1.BeginUpdate();
exgraph1.AutoFit = true;
exontrol.EXGRAPHLib.CategoryAxis var_CategoryAxis = exgraph1.CategoryAxis;
	var_CategoryAxis.Categories = "Anchorage,Juneau,Fairbanks,Sitka,Ketchikan,Wasilla,Kenai,Kodiak,Bethel,Palmer";
	exontrol.EXGRAPHLib.FormatGridLinesOptions var_FormatGridLinesOptions = var_CategoryAxis.ChartGridLines;
		var_FormatGridLinesOptions.Color = "red";
		var_FormatGridLinesOptions.Format = "index";
exgraph1.Series.Add("291247,32269,30917,8588,8208,10529,7757,5968,6481,7393",null);
exgraph1.EndUpdate();
|
|
37
|
Specifies the grid-line's width or size (chart, overview)
exgraph1.BeginUpdate();
exgraph1.AutoFit = true;
exontrol.EXGRAPHLib.CategoryAxis var_CategoryAxis = exgraph1.CategoryAxis;
	var_CategoryAxis.Categories = "Anchorage,Juneau,Fairbanks,Sitka,Ketchikan,Wasilla,Kenai,Kodiak,Bethel,Palmer";
	exontrol.EXGRAPHLib.FormatGridLinesOptions var_FormatGridLinesOptions = var_CategoryAxis.ChartGridLines;
		var_FormatGridLinesOptions.Color = "black";
		var_FormatGridLinesOptions.Format = "index";
		var_FormatGridLinesOptions.Width = 2;
exgraph1.Series.Add("291247,32269,30917,8588,8208,10529,7757,5968,6481,7393",null);
exgraph1.EndUpdate();
|
|
36
|
Occurs when the user dblclk the left mouse button over an object
// DblClick event - Occurs when the user dblclk the left mouse button over an object.
private void exgraph1_DblClick(object sender,short Shift,int X,int Y)
{
System.Diagnostics.Debug.Print( "DblClick event" );
}
//this.exgraph1.DblClick += new exontrol.EXGRAPHLib.exg2antt.DblClickEventHandler(this.exgraph1_DblClick);
exgraph1.ValueSize = 18;
exontrol.EXGRAPHLib.Serie var_Serie = exgraph1.Series.Add("Hulunbuir{China}(263068),Abu Dhabi{United Arab Emirates}(97200),Jiuquan{China}(167996),Altamira{Brazil}(159891),Bras�lia{Brazil" +
"}(5784),Mumbai{India}(603.4),Delhi{India}(1484),Chongqing{China}(82400),Hulunbuir{China}(263068),Sao Paulo{Brazil}(1522),Linfen{" +
"China}(20527),Santiago{Chile}(641),Mexico City{Mexico}(1485),Belo Horizonte{Brazil}(313),Hangzhou{China}(16817),Nairobi{Kenya}(6" +
"96),Berlin{Germany}(891.68),Montreal{Canada}(431.5),Cordoba{Argentina}(576),Manaus{Brazil}(11401),Astana{Kazakhstan}(810),Goi�ni" +
"a{Brazil}(741),Cali{Colombia}(564),Sao Paulo{Brazil}(1522),Goiania{Brazil}(781)",null);
var_Serie.Type = "Col";
var_Serie.Vertical = true;
exgraph1.Sort = "0:D";
|
|
35
|
Occurs when the user presses and then releases the left mouse button over the control
// Click event - Occurs when the user presses and then releases the left mouse button over the control.
private void exgraph1_Click(object sender)
{
System.Diagnostics.Debug.Print( "Click event" );
}
//this.exgraph1.Click += new exontrol.EXGRAPHLib.exg2antt.ClickEventHandler(this.exgraph1_Click);
exgraph1.ValueSize = 18;
exontrol.EXGRAPHLib.Serie var_Serie = exgraph1.Series.Add("Hulunbuir{China}(263068),Abu Dhabi{United Arab Emirates}(97200),Jiuquan{China}(167996),Altamira{Brazil}(159891),Bras�lia{Brazil" +
"}(5784),Mumbai{India}(603.4),Delhi{India}(1484),Chongqing{China}(82400),Hulunbuir{China}(263068),Sao Paulo{Brazil}(1522),Linfen{" +
"China}(20527),Santiago{Chile}(641),Mexico City{Mexico}(1485),Belo Horizonte{Brazil}(313),Hangzhou{China}(16817),Nairobi{Kenya}(6" +
"96),Berlin{Germany}(891.68),Montreal{Canada}(431.5),Cordoba{Argentina}(576),Manaus{Brazil}(11401),Astana{Kazakhstan}(810),Goi�ni" +
"a{Brazil}(741),Cali{Colombia}(564),Sao Paulo{Brazil}(1522),Goiania{Brazil}(781)",null);
var_Serie.Type = "Col";
var_Serie.Vertical = true;
|
|
34
|
Determine the code of the key the user presses
// KeyPress event - Occurs when the user presses and releases an ANSI key.
private void exgraph1_KeyPress(object sender,ref short   KeyAscii)
{
	// print"KeyAscii",KeyAscii)
}
//this.exgraph1.KeyPress += new exontrol.EXGRAPHLib.exg2antt.KeyPressEventHandler(this.exgraph1_KeyPress);

exgraph1.ValueSize = 48;
exgraph1.set_Misc(exontrol.EXGRAPHLib.MiscEnum.exUpdateRangeOnScroll,0);
exontrol.EXGRAPHLib.Serie var_Serie = exgraph1.Series.Add("China(1403500365),India(1368737513),UnitedStates(330810184),Indonesia(272881945),Pakistan(220892331),Brazil(212559417),Nigeria(" +
"206139587),Bangladesh(169575884),Russia(145912025),Mexico(128932753),Japan(126476458),Ethiopia(114963588),Philippines(112392078)" +
",Egypt(110530608),Vietnam(97429061),DR.Congo(89561404),Turkey(84339067),Iran(83720412),Germany(83132799),Thailand(69799978),Unit" +
"edKingdom(68207116),France(65311982),Italy(59554028),Tanzania(59091392),SouthAfrica(58775022)",null);
	var_Serie.Type = "Pie";
	var_Serie.ShowValue = exontrol.EXGRAPHLib.ShowValueEnum.exValue | exontrol.EXGRAPHLib.ShowValueEnum.exLine | exontrol.EXGRAPHLib.ShowValueEnum.exPoint;
	var_Serie.ValueFormat = "category";
|
|
33
|
Determine the code of the key the user just released
// KeyUp event - Occurs when the user releases a key while an object has the focus.
private void exgraph1_KeyUp(object sender,ref short   KeyCode,short   Shift)
{
	// print"KeyCode",KeyCode)
}
//this.exgraph1.KeyUp += new exontrol.EXGRAPHLib.exg2antt.KeyUpEventHandler(this.exgraph1_KeyUp);

exgraph1.ValueSize = 48;
exgraph1.set_Misc(exontrol.EXGRAPHLib.MiscEnum.exUpdateRangeOnScroll,0);
exgraph1.Series.Add("Russia(17098242),Canada(9984670),China(9596961),UnitedStates(9525067),Brazil(8515767),Australia(7692024),India(3287263),Argenti" +
"na(2780400),Kazakhstan(2724900),Algeria(2381741),CongoDemocraticRepublicofthe(2344858),Greenland(2166086),SaudiArabia(2149690),M" +
"exico(1964375),Indonesia(1904569),Sudan(1861484),Libya(1759540),Iran(1648195),Mongolia(1564116),Peru(1285216),Niger(1267000),Cha" +
"d(1284000),Angola(1246700),Mali(1240192),SouthAfrica(1221037)",null);
|
|
32
|
Determine the code of the key the user presses
// KeyDown event - Occurs when the user presses a key while an object has the focus.
private void exgraph1_KeyDown(object sender,ref short   KeyCode,short   Shift)
{
	// print"KeyCode",KeyCode)
}
//this.exgraph1.KeyDown += new exontrol.EXGRAPHLib.exg2antt.KeyDownEventHandler(this.exgraph1_KeyDown);

exgraph1.ValueSize = 48;
exgraph1.set_Misc(exontrol.EXGRAPHLib.MiscEnum.exUpdateRangeOnScroll,0);
exgraph1.Series.Add("Russia(17098242),Canada(9984670),China(9596961),UnitedStates(9525067),Brazil(8515767),Australia(7692024),India(3287263),Argenti" +
"na(2780400),Kazakhstan(2724900),Algeria(2381741),CongoDemocraticRepublicofthe(2344858),Greenland(2166086),SaudiArabia(2149690),M" +
"exico(1964375),Indonesia(1904569),Sudan(1861484),Libya(1759540),Iran(1648195),Mongolia(1564116),Peru(1285216),Niger(1267000),Cha" +
"d(1284000),Angola(1246700),Mali(1240192),SouthAfrica(1221037)",null);
|
|
31
|
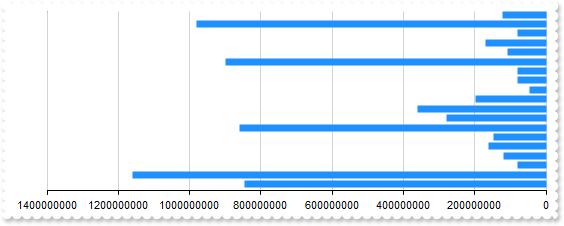
How can reverse the chart
exgraph1.AutoFit = true;
exgraph1.ValueAxis.Reverse = true;
exontrol.EXGRAPHLib.Serie var_Serie = exgraph1.Series.Add("Friendster(121111111),Facebook(979750000),Flickr(79664888),Google Buzz(170000000),Google+(107319100),Hi5(900202990),Instagram(8" +
"0202990),MySpace(80202990),Orkut(45067022),Pinterest(197319100),Reddit(360250000),Snapchat(280250000),TikTok(860250000),Tumblr(1" +
"46890156),Twitter(160250000),WeChat(118123370),Weibo(79195730),Whatsapp(1160250000),YouTube(844638200)",null);
	var_Serie.Vertical = true;
exgraph1.SeriesColors = "dodgerblue";
|
|
30
|
How do I enable the scrollbar-extension, as thumb to be shown outside of the control's client area
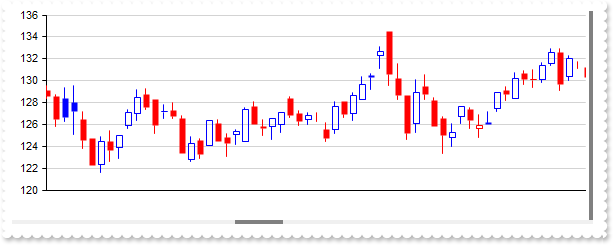
exgraph1.BeginUpdate();
exgraph1.ScrollBars = exontrol.EXGRAPHLib.ScrollBarsEnum.exDisableBoth;
exgraph1.set_ScrollPartVisible(exontrol.EXGRAPHLib.ScrollBarEnum.exVScroll,exontrol.EXGRAPHLib.ScrollPartEnum.exExtentThumbPart,true);
exgraph1.set_ScrollPartVisible(exontrol.EXGRAPHLib.ScrollBarEnum.exHScroll,exontrol.EXGRAPHLib.ScrollPartEnum.exExtentThumbPart,true);
exgraph1.set_ScrollPartVisible((exontrol.EXGRAPHLib.ScrollBarEnum)0x2,exontrol.EXGRAPHLib.ScrollPartEnum.exExtentThumbPart,true);
exgraph1.ScrollWidth = 4;
exgraph1.set_Background((exontrol.EXGRAPHLib.BackgroundPartEnum)0x114,Color.FromArgb(240,240,240));
exgraph1.set_Background((exontrol.EXGRAPHLib.BackgroundPartEnum)0x104,Color.FromArgb(128,128,128));
exgraph1.ScrollHeight = 4;
exgraph1.set_Background((exontrol.EXGRAPHLib.BackgroundPartEnum)0x194,exgraph1.get_Background((exontrol.EXGRAPHLib.BackgroundPartEnum)0x114));
exgraph1.set_Background((exontrol.EXGRAPHLib.BackgroundPartEnum)0x184,exgraph1.get_Background((exontrol.EXGRAPHLib.BackgroundPartEnum)0x104));
exgraph1.set_Background((exontrol.EXGRAPHLib.BackgroundPartEnum)0x12c | exontrol.EXGRAPHLib.BackgroundPartEnum.exSerieCursorTooltipTransparent,exgraph1.get_Background((exontrol.EXGRAPHLib.BackgroundPartEnum)0x114));
exgraph1.BeginUpdate();
exgraph1.ValueSize = 6;
exgraph1.Data = "C:\\Program Files\\Exontrol\\ExGraph\\Sample\\Data/aapl.txt";
exontrol.EXGRAPHLib.Serie var_Serie = exgraph1.Series.Add(null,null);
	var_Serie.Name = "aapl";
	var_Serie.Data = "AAPL (open),AAPL (high),AAPL (low),AAPL (close)";
	var_Serie.Type = "candle";
exgraph1.EndUpdate();
exgraph1.EndUpdate();
|
|
29
|
Define a bubble chart-type
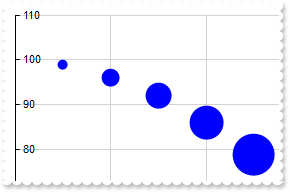
exontrol.EXGRAPHLib.Serie var_Serie = exgraph1.Series.Add(null,null);
	var_Serie.Data = "1 99 1,2 96 2,3 92 3,4 86 4,5 79 5,6 70 6,7 60 7,8 50 8,9 38 9,10 25 10,11 13 11";
	var_Serie.Type = "bubble";
	var_Serie.set_Misc(exontrol.EXGRAPHLib.SerieMiscEnum.exScatterPlotSize,96);
|
|
28
|
Is it possible to show the values with the same color (method 2)
exgraph1.BeginUpdate();
exgraph1.AutoFit = true;
exgraph1.set_Misc(exontrol.EXGRAPHLib.MiscEnum.exValueAxisFitLabel,true);
exgraph1.set_Misc(exontrol.EXGRAPHLib.MiscEnum.exValueLineAddAngle,0);
exgraph1.ValuePoint = ",,,,,,,,,0,0";
exontrol.EXGRAPHLib.ValueAxis var_ValueAxis = exgraph1.ValueAxis;
	var_ValueAxis.Format = "value ? (value / 1000000)  + `<br><c>mil`: ``";
	var_ValueAxis.Tfi = "<fgcolor gray> bold";
exontrol.EXGRAPHLib.Serie var_Serie = exgraph1.Series.Add("China(1439323776),India(1380004385),US(331002651),Indonesia(273523615),Pakistan(220892340),Brazil(212559417),Nigeria(206139589)" +
",Bangladesh(164689383),Russia(145934462),Mexico(128932753)",null);
	var_Serie.Type = "column";
	var_Serie.ShowValue = exontrol.EXGRAPHLib.ShowValueEnum.exValue | exontrol.EXGRAPHLib.ShowValueEnum.exLine | exontrol.EXGRAPHLib.ShowValueEnum.exPoint;
	var_Serie.ValueFormat = "((value format ``) replace `.00` with ``)";
	var_Serie.Color = "blue";
exgraph1.Sort = "0:D";
exgraph1.EndUpdate();
|
|
27
|
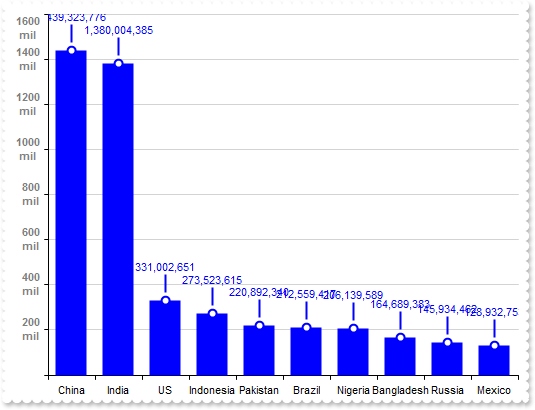
Is it possible to show the values with the same color (method 1)
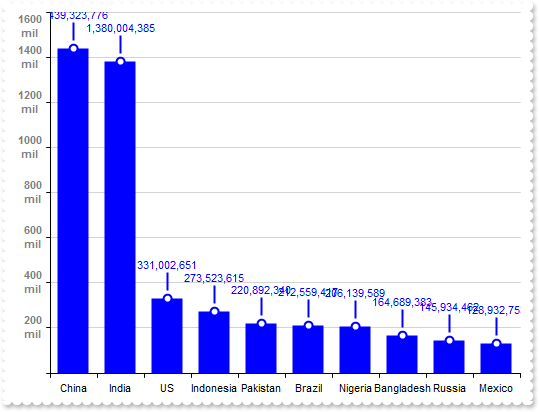
exgraph1.BeginUpdate();
exgraph1.AutoFit = true;
exgraph1.set_Misc(exontrol.EXGRAPHLib.MiscEnum.exValueAxisFitLabel,true);
exgraph1.set_Misc(exontrol.EXGRAPHLib.MiscEnum.exValueLineAddAngle,0);
exgraph1.ValuePoint = ",,,,,,,,,0,0";
exontrol.EXGRAPHLib.ValueAxis var_ValueAxis = exgraph1.ValueAxis;
	var_ValueAxis.Format = "value ? (value / 1000000)  + `<br><c>mil`: ``";
	var_ValueAxis.Tfi = "<fgcolor gray> bold";
exontrol.EXGRAPHLib.Serie var_Serie = exgraph1.Series.Add("China(1439323776),India(1380004385),US(331002651),Indonesia(273523615),Pakistan(220892340),Brazil(212559417),Nigeria(206139589)" +
",Bangladesh(164689383),Russia(145934462),Mexico(128932753)",null);
	var_Serie.Type = "column";
	var_Serie.ShowValue = exontrol.EXGRAPHLib.ShowValueEnum.exValue | exontrol.EXGRAPHLib.ShowValueEnum.exLine | exontrol.EXGRAPHLib.ShowValueEnum.exPoint;
	var_Serie.ValueFormat = "((value format ``) replace `.00` with ``)";
exgraph1.Series.Add("0",null).Visible = false;
exgraph1.Sort = "0:D";
exgraph1.EndUpdate();
|
|
26
|
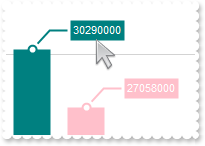
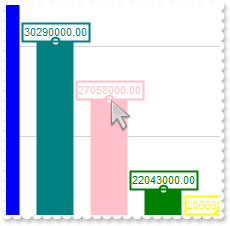
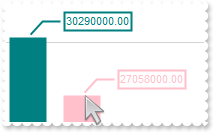
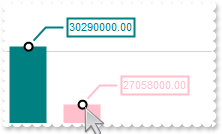
Pie chart
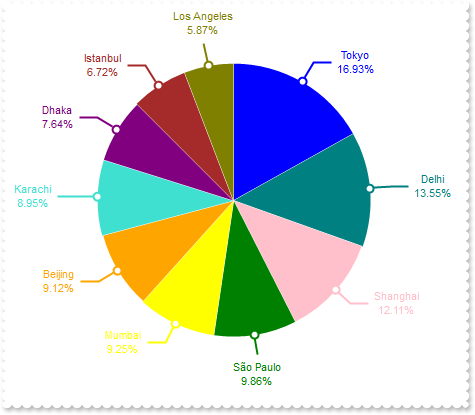
exgraph1.BeginUpdate();
exontrol.EXGRAPHLib.Serie var_Serie = exgraph1.Series.Add("Tokyo(37833000), Delhi(30290000), Shanghai(27058000), S�o Paulo(22043000), Mumbai(20668000), Beijing(20384000), Karachi(2000000" +
"0), Dhaka(17072000), Istanbul(15029000), Los Angeles(13131000)",null);
var_Serie.Type = "pie";
var_Serie.ShowValue = (exontrol.EXGRAPHLib.ShowValueEnum)0xffffff78 | exontrol.EXGRAPHLib.ShowValueEnum.exHideIfEmpty | exontrol.EXGRAPHLib.ShowValueEnum.exValue | exontrol.EXGRAPHLib.ShowValueEnum.exLine | exontrol.EXGRAPHLib.ShowValueEnum.exPoint;
var_Serie.ValueFormat = "category + `<br>` + ((percent) format ``) + `%`";
var_Serie.LegendFormat = "label + `(` + ((percent) format ``) + `%)`";
exgraph1.ValuePoint = ",,,,,,,,transparent";
exontrol.EXGRAPHLib.Legend var_Legend = exgraph1.Legend;
var_Legend.Visible = true;
exgraph1.EndUpdate();
|
|
25
|
Define the pad for value-label
exgraph1.BeginUpdate();
exgraph1.AutoFit = true;
exgraph1.ValueAxis.Format = "value/100000";
exontrol.EXGRAPHLib.Serie var_Serie = exgraph1.Series.Add("Tokyo(37833000), Delhi(30290000), Shanghai(27058000), S�o Paulo(22043000), Mumbai(20668000), Beijing(20384000), Karachi(2000000" +
"0), Dhaka(17072000), Istanbul(15029000), Los Angeles(13131000)",null);
var_Serie.ShowValue = (exontrol.EXGRAPHLib.ShowValueEnum)0xffffff78 | exontrol.EXGRAPHLib.ShowValueEnum.exHideIfEmpty | exontrol.EXGRAPHLib.ShowValueEnum.exValue | exontrol.EXGRAPHLib.ShowValueEnum.exLine | exontrol.EXGRAPHLib.ShowValueEnum.exPoint;
exgraph1.ValuePoint = ",,,,,,,,,,8";
exgraph1.EndUpdate();
|
|
24
|
Hide the frame around the value-label
exgraph1.BeginUpdate();
exgraph1.AutoFit = true;
exgraph1.ValueAxis.Format = "value/100000";
exontrol.EXGRAPHLib.Serie var_Serie = exgraph1.Series.Add("Tokyo(37833000), Delhi(30290000), Shanghai(27058000), S�o Paulo(22043000), Mumbai(20668000), Beijing(20384000), Karachi(2000000" +
"0), Dhaka(17072000), Istanbul(15029000), Los Angeles(13131000)",null);
var_Serie.ShowValue = (exontrol.EXGRAPHLib.ShowValueEnum)0xffffff78 | exontrol.EXGRAPHLib.ShowValueEnum.exHideIfEmpty | exontrol.EXGRAPHLib.ShowValueEnum.exValue | exontrol.EXGRAPHLib.ShowValueEnum.exLine | exontrol.EXGRAPHLib.ShowValueEnum.exPoint;
exgraph1.ValuePoint = ",,,,,,,,,0";
exgraph1.EndUpdate();
|
|
23
|
Remove the frame around the value-label
exgraph1.BeginUpdate();
exgraph1.AutoFit = true;
exgraph1.ValueAxis.Format = "value/100000";
exontrol.EXGRAPHLib.Serie var_Serie = exgraph1.Series.Add("Tokyo(37833000), Delhi(30290000), Shanghai(27058000), S�o Paulo(22043000), Mumbai(20668000), Beijing(20384000), Karachi(2000000" +
"0), Dhaka(17072000), Istanbul(15029000), Los Angeles(13131000)",null);
var_Serie.ShowValue = (exontrol.EXGRAPHLib.ShowValueEnum)0xffffff78 | exontrol.EXGRAPHLib.ShowValueEnum.exHideIfEmpty | exontrol.EXGRAPHLib.ShowValueEnum.exValue | exontrol.EXGRAPHLib.ShowValueEnum.exLine | exontrol.EXGRAPHLib.ShowValueEnum.exPoint;
exgraph1.ValuePoint = ",,,,,,,,transparent";
exgraph1.EndUpdate();
|
|
22
|
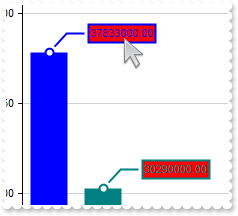
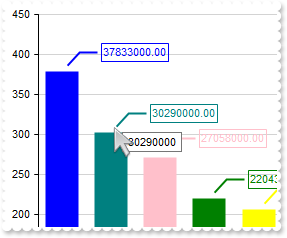
Apply the color of the data-value to the value-label
exgraph1.BeginUpdate();
exgraph1.AutoFit = true;
exgraph1.ValueAxis.Format = "value/100000";
exontrol.EXGRAPHLib.Serie var_Serie = exgraph1.Series.Add("Tokyo(37833000), Delhi(30290000), Shanghai(27058000), S�o Paulo(22043000), Mumbai(20668000), Beijing(20384000), Karachi(2000000" +
"0), Dhaka(17072000), Istanbul(15029000), Los Angeles(13131000)",null);
var_Serie.ShowValue = (exontrol.EXGRAPHLib.ShowValueEnum)0xffffff78 | exontrol.EXGRAPHLib.ShowValueEnum.exHideIfEmpty | exontrol.EXGRAPHLib.ShowValueEnum.exValue | exontrol.EXGRAPHLib.ShowValueEnum.exLine | exontrol.EXGRAPHLib.ShowValueEnum.exPoint;
var_Serie.ValueFormat = "`<fgcolor white>` + value";
exgraph1.ValuePoint = ",,,,,,,null";
exgraph1.EndUpdate();
|
|
21
|
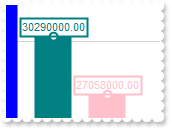
Apply an opaque color to the value-label
exgraph1.BeginUpdate();
exgraph1.AutoFit = true;
exgraph1.ValueAxis.Format = "value/100000";
exontrol.EXGRAPHLib.Serie var_Serie = exgraph1.Series.Add("Tokyo(37833000), Delhi(30290000), Shanghai(27058000), S�o Paulo(22043000), Mumbai(20668000), Beijing(20384000), Karachi(2000000" +
"0), Dhaka(17072000), Istanbul(15029000), Los Angeles(13131000)",null);
var_Serie.ShowValue = (exontrol.EXGRAPHLib.ShowValueEnum)0xffffff78 | exontrol.EXGRAPHLib.ShowValueEnum.exHideIfEmpty | exontrol.EXGRAPHLib.ShowValueEnum.exValue | exontrol.EXGRAPHLib.ShowValueEnum.exLine | exontrol.EXGRAPHLib.ShowValueEnum.exPoint;
exgraph1.ValuePoint = ",,,,,,,red";
exgraph1.EndUpdate();
|
|
20
|
Remove the line that connects the value point to value-label (method 2)
exgraph1.BeginUpdate();
exgraph1.AutoFit = true;
exgraph1.ValueAxis.Format = "value/100000";
exontrol.EXGRAPHLib.Serie var_Serie = exgraph1.Series.Add("Tokyo(37833000), Delhi(30290000), Shanghai(27058000), S�o Paulo(22043000), Mumbai(20668000), Beijing(20384000), Karachi(2000000" +
"0), Dhaka(17072000), Istanbul(15029000), Los Angeles(13131000)",null);
var_Serie.ShowValue = (exontrol.EXGRAPHLib.ShowValueEnum)0xffffff78 | exontrol.EXGRAPHLib.ShowValueEnum.exHideIfEmpty | exontrol.EXGRAPHLib.ShowValueEnum.exValue | exontrol.EXGRAPHLib.ShowValueEnum.exLine | exontrol.EXGRAPHLib.ShowValueEnum.exPoint;
exgraph1.ValuePoint = ",,,,,,0";
exgraph1.EndUpdate();
|
|
19
|
Define a shorter line (connects the value point to value-label)
exgraph1.BeginUpdate();
exgraph1.AutoFit = true;
exgraph1.ValueAxis.Format = "value/100000";
exontrol.EXGRAPHLib.Serie var_Serie = exgraph1.Series.Add("Tokyo(37833000), Delhi(30290000), Shanghai(27058000), S�o Paulo(22043000), Mumbai(20668000), Beijing(20384000), Karachi(2000000" +
"0), Dhaka(17072000), Istanbul(15029000), Los Angeles(13131000)",null);
var_Serie.ShowValue = (exontrol.EXGRAPHLib.ShowValueEnum)0xffffff78 | exontrol.EXGRAPHLib.ShowValueEnum.exHideIfEmpty | exontrol.EXGRAPHLib.ShowValueEnum.exValue | exontrol.EXGRAPHLib.ShowValueEnum.exLine | exontrol.EXGRAPHLib.ShowValueEnum.exPoint;
exgraph1.ValuePoint = ",,,,,,8";
exgraph1.EndUpdate();
|
|
18
|
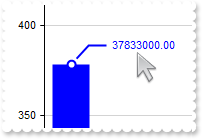
Define the size of the line that connects the value point to value-label
exgraph1.BeginUpdate();
exgraph1.AutoFit = true;
exgraph1.ValueAxis.Format = "value/100000";
exontrol.EXGRAPHLib.Serie var_Serie = exgraph1.Series.Add("Tokyo(37833000), Delhi(30290000), Shanghai(27058000), S�o Paulo(22043000), Mumbai(20668000), Beijing(20384000), Karachi(2000000" +
"0), Dhaka(17072000), Istanbul(15029000), Los Angeles(13131000)",null);
var_Serie.ShowValue = (exontrol.EXGRAPHLib.ShowValueEnum)0xffffff78 | exontrol.EXGRAPHLib.ShowValueEnum.exHideIfEmpty | exontrol.EXGRAPHLib.ShowValueEnum.exValue | exontrol.EXGRAPHLib.ShowValueEnum.exLine | exontrol.EXGRAPHLib.ShowValueEnum.exPoint;
exgraph1.ValuePoint = ",,,,,1";
exgraph1.EndUpdate();
|
|
17
|
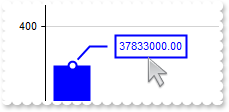
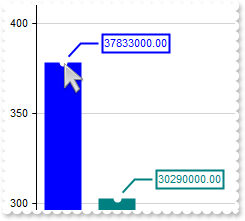
Hide the line that connects the value point to value-label
exgraph1.BeginUpdate();
exgraph1.AutoFit = true;
exgraph1.ValueAxis.Format = "value/100000";
exontrol.EXGRAPHLib.Serie var_Serie = exgraph1.Series.Add("Tokyo(37833000), Delhi(30290000), Shanghai(27058000), S�o Paulo(22043000), Mumbai(20668000), Beijing(20384000), Karachi(2000000" +
"0), Dhaka(17072000), Istanbul(15029000), Los Angeles(13131000)",null);
var_Serie.ShowValue = (exontrol.EXGRAPHLib.ShowValueEnum)0xffffff78 | exontrol.EXGRAPHLib.ShowValueEnum.exHideIfEmpty | exontrol.EXGRAPHLib.ShowValueEnum.exValue | exontrol.EXGRAPHLib.ShowValueEnum.exLine | exontrol.EXGRAPHLib.ShowValueEnum.exPoint;
exgraph1.ValuePoint = ",,,,,0";
exgraph1.EndUpdate();
|
|
16
|
Remove the line that connects the value point to value-label (method 1)
exgraph1.BeginUpdate();
exgraph1.AutoFit = true;
exgraph1.ValueAxis.Format = "value/100000";
exontrol.EXGRAPHLib.Serie var_Serie = exgraph1.Series.Add("Tokyo(37833000), Delhi(30290000), Shanghai(27058000), S�o Paulo(22043000), Mumbai(20668000), Beijing(20384000), Karachi(2000000" +
"0), Dhaka(17072000), Istanbul(15029000), Los Angeles(13131000)",null);
var_Serie.ShowValue = (exontrol.EXGRAPHLib.ShowValueEnum)0xffffff78 | exontrol.EXGRAPHLib.ShowValueEnum.exHideIfEmpty | exontrol.EXGRAPHLib.ShowValueEnum.exValue | exontrol.EXGRAPHLib.ShowValueEnum.exLine | exontrol.EXGRAPHLib.ShowValueEnum.exPoint;
exgraph1.ValuePoint = ",,,,transparent";
exgraph1.EndUpdate();
|
|
15
|
Change the color to show the line that connects the value point to value-label
exgraph1.BeginUpdate();
exgraph1.AutoFit = true;
exgraph1.ValueAxis.Format = "value/100000";
exontrol.EXGRAPHLib.Serie var_Serie = exgraph1.Series.Add("Tokyo(37833000), Delhi(30290000), Shanghai(27058000), S�o Paulo(22043000), Mumbai(20668000), Beijing(20384000), Karachi(2000000" +
"0), Dhaka(17072000), Istanbul(15029000), Los Angeles(13131000)",null);
var_Serie.ShowValue = (exontrol.EXGRAPHLib.ShowValueEnum)0xffffff78 | exontrol.EXGRAPHLib.ShowValueEnum.exHideIfEmpty | exontrol.EXGRAPHLib.ShowValueEnum.exValue | exontrol.EXGRAPHLib.ShowValueEnum.exLine | exontrol.EXGRAPHLib.ShowValueEnum.exPoint;
exgraph1.ValuePoint = ",,,,red";
exgraph1.EndUpdate();
|
|
14
|
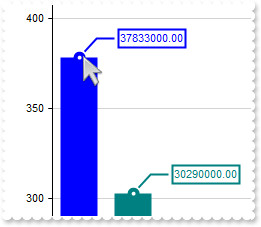
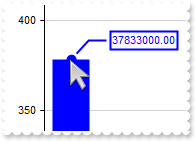
Change the frame's size around the value-point
exgraph1.BeginUpdate();
exgraph1.AutoFit = true;
exgraph1.ValueAxis.Format = "value/100000";
exontrol.EXGRAPHLib.Serie var_Serie = exgraph1.Series.Add("Tokyo(37833000), Delhi(30290000), Shanghai(27058000), S�o Paulo(22043000), Mumbai(20668000), Beijing(20384000), Karachi(2000000" +
"0), Dhaka(17072000), Istanbul(15029000), Los Angeles(13131000)",null);
var_Serie.ShowValue = (exontrol.EXGRAPHLib.ShowValueEnum)0xffffff78 | exontrol.EXGRAPHLib.ShowValueEnum.exHideIfEmpty | exontrol.EXGRAPHLib.ShowValueEnum.exValue | exontrol.EXGRAPHLib.ShowValueEnum.exLine | exontrol.EXGRAPHLib.ShowValueEnum.exPoint;
exgraph1.ValuePoint = ",,,4";
exgraph1.EndUpdate();
|
|
13
|
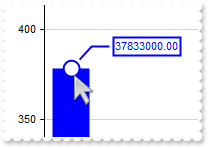
Change the frame's size around the value-point
exgraph1.BeginUpdate();
exgraph1.AutoFit = true;
exgraph1.ValueAxis.Format = "value/100000";
exontrol.EXGRAPHLib.Serie var_Serie = exgraph1.Series.Add("Tokyo(37833000), Delhi(30290000), Shanghai(27058000), S�o Paulo(22043000), Mumbai(20668000), Beijing(20384000), Karachi(2000000" +
"0), Dhaka(17072000), Istanbul(15029000), Los Angeles(13131000)",null);
var_Serie.ShowValue = (exontrol.EXGRAPHLib.ShowValueEnum)0xffffff78 | exontrol.EXGRAPHLib.ShowValueEnum.exHideIfEmpty | exontrol.EXGRAPHLib.ShowValueEnum.exValue | exontrol.EXGRAPHLib.ShowValueEnum.exLine | exontrol.EXGRAPHLib.ShowValueEnum.exPoint;
exgraph1.ValuePoint = ",,,0";
exgraph1.EndUpdate();
|
|
12
|
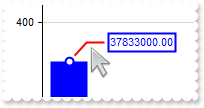
Hide the value-points, but still the value-label (method 2)
exgraph1.BeginUpdate();
exgraph1.AutoFit = true;
exgraph1.ValueAxis.Format = "value/100000";
exontrol.EXGRAPHLib.Serie var_Serie = exgraph1.Series.Add("Tokyo(37833000), Delhi(30290000), Shanghai(27058000), S�o Paulo(22043000), Mumbai(20668000), Beijing(20384000), Karachi(2000000" +
"0), Dhaka(17072000), Istanbul(15029000), Los Angeles(13131000)",null);
var_Serie.ShowValue = (exontrol.EXGRAPHLib.ShowValueEnum)0xffffff78 | exontrol.EXGRAPHLib.ShowValueEnum.exHideIfEmpty | exontrol.EXGRAPHLib.ShowValueEnum.exValue | exontrol.EXGRAPHLib.ShowValueEnum.exLine | exontrol.EXGRAPHLib.ShowValueEnum.exPoint;
exgraph1.ValuePoint = ",transparent,transparent";
exgraph1.EndUpdate();
|
|
11
|
Hide the value-points, but still the value-label (method 1)
exgraph1.BeginUpdate();
exgraph1.AutoFit = true;
exgraph1.ValueAxis.Format = "value/100000";
exontrol.EXGRAPHLib.Serie var_Serie = exgraph1.Series.Add("Tokyo(37833000), Delhi(30290000), Shanghai(27058000), S�o Paulo(22043000), Mumbai(20668000), Beijing(20384000), Karachi(2000000" +
"0), Dhaka(17072000), Istanbul(15029000), Los Angeles(13131000)",null);
var_Serie.ShowValue = (exontrol.EXGRAPHLib.ShowValueEnum)0xffffff78 | exontrol.EXGRAPHLib.ShowValueEnum.exHideIfEmpty | exontrol.EXGRAPHLib.ShowValueEnum.exValue | exontrol.EXGRAPHLib.ShowValueEnum.exLine | exontrol.EXGRAPHLib.ShowValueEnum.exPoint;
exgraph1.ValuePoint = "0";
exgraph1.EndUpdate();
|
|
10
|
Change the color to show the border of the value-point
exgraph1.BeginUpdate();
exgraph1.AutoFit = true;
exgraph1.ValueAxis.Format = "value/100000";
exontrol.EXGRAPHLib.Serie var_Serie = exgraph1.Series.Add("Tokyo(37833000), Delhi(30290000), Shanghai(27058000), S�o Paulo(22043000), Mumbai(20668000), Beijing(20384000), Karachi(2000000" +
"0), Dhaka(17072000), Istanbul(15029000), Los Angeles(13131000)",null);
var_Serie.ShowValue = (exontrol.EXGRAPHLib.ShowValueEnum)0xffffff78 | exontrol.EXGRAPHLib.ShowValueEnum.exHideIfEmpty | exontrol.EXGRAPHLib.ShowValueEnum.exValue | exontrol.EXGRAPHLib.ShowValueEnum.exLine | exontrol.EXGRAPHLib.ShowValueEnum.exPoint;
exgraph1.ValuePoint = ",,black";
exgraph1.EndUpdate();
|
|
9
|
Makes the value point to show in the data-color
exgraph1.BeginUpdate();
exgraph1.AutoFit = true;
exgraph1.ValueAxis.Format = "value/100000";
exontrol.EXGRAPHLib.Serie var_Serie = exgraph1.Series.Add("Tokyo(37833000), Delhi(30290000), Shanghai(27058000), S�o Paulo(22043000), Mumbai(20668000), Beijing(20384000), Karachi(2000000" +
"0), Dhaka(17072000), Istanbul(15029000), Los Angeles(13131000)",null);
var_Serie.ShowValue = (exontrol.EXGRAPHLib.ShowValueEnum)0xffffff78 | exontrol.EXGRAPHLib.ShowValueEnum.exHideIfEmpty | exontrol.EXGRAPHLib.ShowValueEnum.exValue | exontrol.EXGRAPHLib.ShowValueEnum.exLine | exontrol.EXGRAPHLib.ShowValueEnum.exPoint;
exgraph1.ValuePoint = ",null";
exgraph1.EndUpdate();
|
|
8
|
Defines bigger value-points
exgraph1.BeginUpdate();
exgraph1.AutoFit = true;
exgraph1.ValueAxis.Format = "value/100000";
exontrol.EXGRAPHLib.Serie var_Serie = exgraph1.Series.Add("Tokyo(37833000), Delhi(30290000), Shanghai(27058000), S�o Paulo(22043000), Mumbai(20668000), Beijing(20384000), Karachi(2000000" +
"0), Dhaka(17072000), Istanbul(15029000), Los Angeles(13131000)",null);
var_Serie.ShowValue = (exontrol.EXGRAPHLib.ShowValueEnum)0xffffff78 | exontrol.EXGRAPHLib.ShowValueEnum.exHideIfEmpty | exontrol.EXGRAPHLib.ShowValueEnum.exValue | exontrol.EXGRAPHLib.ShowValueEnum.exLine | exontrol.EXGRAPHLib.ShowValueEnum.exPoint;
exgraph1.ValuePoint = "16";
exgraph1.EndUpdate();
|
|
7
|
How can I change the color to show the axes (method 3)
exontrol.EXGRAPHLib.ValueAxis var_ValueAxis = exgraph1.ValueAxis;
	var_ValueAxis.Format = "`<fgcolor red>` + value";
exgraph1.Series.Add("Friendster(121111111),Facebook(979750000),Flickr(79664888),Google Buzz(170000000),Google+(107319100),Hi5(900202990),Instagram(8" +
"0202990),MySpace(80202990),Orkut(45067022),Pinterest(197319100),Reddit(360250000),Snapchat(280250000),TikTok(860250000),Tumblr(1" +
"46890156),Twitter(160250000),WeChat(118123370),Weibo(79195730),Whatsapp(1160250000),YouTube(844638200)",null);
|
|
6
|
How can I change the color to show the axes (method 2)
exontrol.EXGRAPHLib.ValueAxis var_ValueAxis = exgraph1.ValueAxis;
	var_ValueAxis.Tfi = "<fgcolor red>";
exgraph1.Series.Add("Friendster(121111111),Facebook(979750000),Flickr(79664888),Google Buzz(170000000),Google+(107319100),Hi5(900202990),Instagram(8" +
"0202990),MySpace(80202990),Orkut(45067022),Pinterest(197319100),Reddit(360250000),Snapchat(280250000),TikTok(860250000),Tumblr(1" +
"46890156),Twitter(160250000),WeChat(118123370),Weibo(79195730),Whatsapp(1160250000),YouTube(844638200)",null);
|
|
5
|
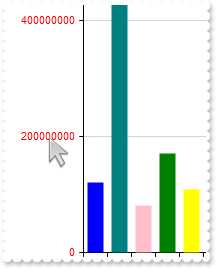
How can I change the color to show the axes (method 1)
exgraph1.ForeColor = Color.FromArgb(255,0,0);
exgraph1.Series.Add("Friendster(121111111),Facebook(979750000),Flickr(79664888),Google Buzz(170000000),Google+(107319100),Hi5(900202990),Instagram(8" +
"0202990),MySpace(80202990),Orkut(45067022),Pinterest(197319100),Reddit(360250000),Snapchat(280250000),TikTok(860250000),Tumblr(1" +
"46890156),Twitter(160250000),WeChat(118123370),Weibo(79195730),Whatsapp(1160250000),YouTube(844638200)",null);
|
|
4
|
Does the control's print supports "fit to page"
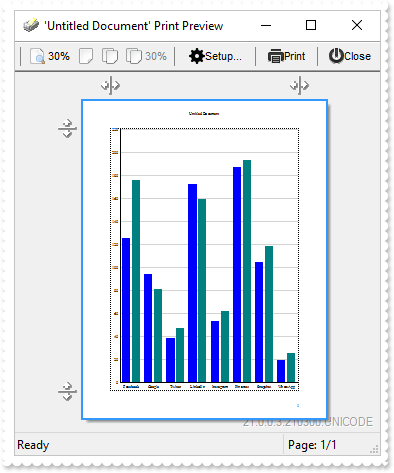
exgraph1.BeginUpdate();
exgraph1.AutoFit = true;
exontrol.EXGRAPHLib.Series var_Series = exgraph1.Series;
	var_Series.Add("Facebook(125),Google(94),Twitter(38),LinkedIn(172),Instagram(53),Pinterest(187),Snapchat(104),WhatsApp(19)",null);
	var_Series.Add("Facebook(176),Google(81),Twitter(47),LinkedIn(159),Instagram(62),Pinterest(193),Snapchat(118),WhatsApp(25)",null);
exgraph1.EndUpdate();
// Add 'exontrol.exprint.dll(ExPrint.dll)' reference to your project.
// Add 'ExPrint 1.0 Control Library(ExPrint.dll)' reference to your project.
exontrol.EXPRINTLib.exprint var_Print = new exontrol.EXPRINTLib.exprint();
	var_Print.PrintExt = (exgraph1 as exontrol.EXGRAPHLib.exgraph);
	var_Print.Preview();
|
|
3
|
How can I print the control
exgraph1.BeginUpdate();
exgraph1.ValueSize = 36;
exgraph1.Series.Add("Facebook(125),Google(94),Twitter(38),LinkedIn(172),Instagram(53),Pinterest(187),Snapchat(104),WhatsApp(19)",null);
exgraph1.EndUpdate();
// Add 'exontrol.exprint.dll(ExPrint.dll)' reference to your project.
// Add 'ExPrint 1.0 Control Library(ExPrint.dll)' reference to your project.
exontrol.EXPRINTLib.exprint var_Print = new exontrol.EXPRINTLib.exprint();
	var_Print.PrintExt = (exgraph1 as exontrol.EXGRAPHLib.exgraph);
	var_Print.Preview();
|
|
2
|
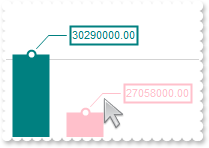
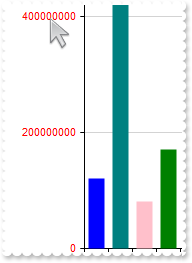
How do I change the control's foreground color
exgraph1.BeginUpdate();
exgraph1.ForeColor = Color.FromArgb(255,0,0);
exgraph1.Series.Add("-1,2,-3,4",null);
exgraph1.AutoFit = true;
exgraph1.EndUpdate();
|
|
1
|
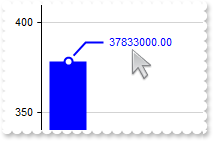
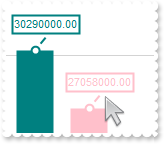
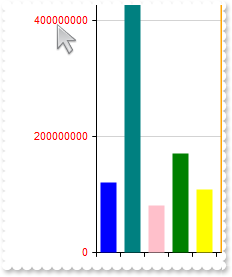
How do I change the control's background color
exgraph1.BeginUpdate();
exgraph1.BackColor = Color.FromArgb(240,240,240);
exgraph1.Series.Add("1,2,3,4",null);
exgraph1.AutoFit = true;
exgraph1.EndUpdate();
|